

Партнерка на США и Канаду по недвижимости, выплаты в крипто
- 30% recurring commission
- Выплаты в USDT
- Вывод каждую неделю
- Комиссия до 5 лет за каждого referral
Oil - production: | 8.457 million bbl/day (2007 est.) |
Oil - consumption: | 20.68 million bbl/day (2007 est.) |
Oil - exports: | 1.165 million bbl/day (2005) |
Oil - imports: | 13.71 million bbl/day (2005) |
Oil - proved reserves: | 20.97 billion bbl (1 January 2008 est.) |
Natural gas - production: | 545.9 billion cu m (2007 est.) |
Natural gas - consumption: | 652.9 billion cu m (2007 est.) |
Natural gas - exports: | 23.28 billion cu m (2007 est.) |
Natural gas - imports: | 130.3 billion cu m (2007 est.) |
Natural gas - proved reserves: | 5.977 trillion cu m (1 January 2008 est.) |
|
Страны | Добыча | Потребление | Экспорт | Импорт | Доказанные запасы млрд тонн |
USA | 415,35 | 1 015,66 | 57,22 | 673,34 | 22,45 |
Russia | 475,27 | 138,06 | 337,21 | 4,91 | 69,10 |
Kazakhstan | 70,62 | 12,29 | 60,26 | 6,52 | 26,00 |

Данные значение за | тыс тонн в год | USA | Russia | Saudi Arabia | Kazakhstan | Евросоюз | in % | OPEC | in % | |
мир добыл в 2008 | 3 ,597 | ,233 | ,759 | ,633 | 70 616,808 | 0,000 | 0% | 1 ,824 | 45% | |
мир потребил в 2008 | 4 ,065 | 1 ,457 | ,299 | ,206 | 12 288,706 | ,427 | 17% | ,208 | 7% | |
Дефицит | -,468 | -,224 | ,460 | ,427 | 58 328,102 | ,43 |
Снижение добычи ОПЕК на 4,2 млн баррелей в сутки с Марта по Июнь 2009 года. Сегодня ОПЕК состоящея из 13 стран добывает 28,8 млн баррелей нефти в день, или есть 3,929,2059 млн тонн нефти в день.
 Петропавловск" width="160" height="41 "/> Петропавловск" width="160" height="41 "/> |
 |
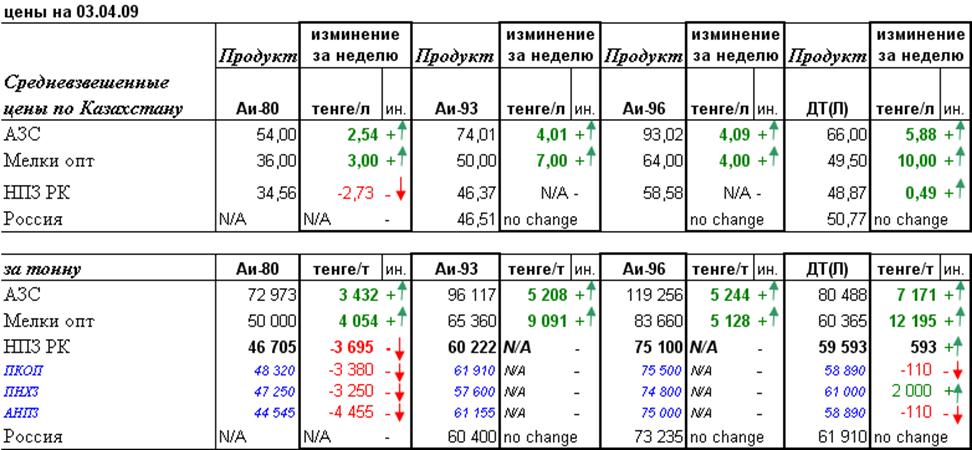
Питер | цена |
Аи-80 | N/A |
Аи-93 | 60 400 |
Аи-96 | 73 235 |
ДТ(Л) | 61 910 |
ПНХЗ | цена |
Аи-80 | 47 250 |
Аи-93 | 57 600 |
Аи-96 | 74 800 |
ДТ(Л) | 61 000 |
 |
АНПЗ | цена |
Аи-80 | 44 545 |
Аи-93 | 61 155 |
Аи-96 | 75 000 |
ДТ(Л) | 58 890 |
ПКОП | цена |
Аи-80 | 48 320 |
| 61 910 |
Аи-96 | 75 500 |
ДТ(Л) | 58 890 |
Динамика цен розничного рынка в сравнении с крупно-мелко оптовым рынком ГСМ.

Начиная с середины лета прошлого года цены на розничном рынке, достигнув пиковых значений, начали непрерывное снижение, которое продолжается до сих пор. За этот период (9 месяцев) цены на бензины снизились в среднем на 5,6 рубля (минус 24%), дизельное топливо – на 5,8 рубля (минус 22%). Основная причина снижения розничных цен общеизвестна - это падение мировых цен на нефть, падение спроса на внешнем и внутреннем рынках. Даже в таком успешном регионе как Москва реализация топлива через систему АЗС снизилась на 14%, не говоря уже об отдаленных регионах. В марте 2009 года цены на бензины вернулись на уровни двухлетней давности. Лишь только дизельное топливо превышает этот уровень в среднем на два рубля.
Поводом к снижению все чаще становится активное давление на нефтяных монополистов со стороны Федеральной антимонопольной службы (ФАС). Вот хроника борьбы ФАС с нефтяниками: - осень 2008 г.: ФАС России признала четыре крупнейшие вертикально-интегрированные компании ОАО “Лукойл”, ОАО “НК “Роснефть”, ОАО “Газпром нефть” и ОАО “ТНК-BP Холдинг” нарушившими антимонопольное законодательство. На указанных юридических лиц были наложены штрафы на общую сумму около 6 млрд. рублей;
- 27 марта 2009 г.: ФАС возбудило дело в отношении ОАО “Самаранефтепродукт” (дочка “Роснефти”), выразившимся в поддержании монопольно высокой цены на автомобильный бензин и дизельное топливо на розничном рынке;
- 27 марта 2009 г.: Арбитражный суд Алтайского края отказал ОАО “НК Роснефть-Алтайнефтепродукт” и ОАО “Газпромнефть-Алтай” в удовлетворении заявлений о признании незаконными решения;
- 26 марта 2009 г.: ОАО “ЛУКОЙЛ-Югнефтепродукт» не удалось обжаловать решение и предписание Краснодарского УФАС РФ в
Арбитражном суде Краснодарского края по вопросу нарушения закона о конкуренции.
Не будем утомлять читателей перечислением всех исков ФАС к монополистам. Их достаточно много, более тридцати. Штрафы могут составлять от 1% до 15% выручки от реализации товара.
В последние дни ФАС выступил с новой инициативой, а именно: с целью обеспечения прозрачности ценообразования на рынке нефтепродуктов и развития конкуренции провести разделение юридических лиц внутри холдингов по видам деятельности - хранение, оптовую и розничную торговлю нефтепродуктами. Это сильный ход. Он незначительно повлияет на конечную цену АЗС, но защитит владельцев независимых АЗС от убытков в критические периоды, когда ВИНКи устанавливают цены на собственных АЗС ниже оптовых цен для тех же независимых АЗС.
В качестве критерия оценки «справедливой» цены на АЗС принята средняя доходность АЗС, полученная нами по результатам мониторинга за период относительной стабильности оптовых и розничных цен: - с октября 2006 г. по октябрь 2007 г. За этот период средняя доходность АЗС составляла: по бензину Аи% от себестоимости товара, поступившего на АЗС, с учетом транспортных и операционных затрат (4,2 р/литр); по дизельному топливу - 35% (4,5 р/литр). Исходя также из факта, что фискальная политика по отношению к АЗС за это время не изменилась можно рассчитать «справедливые» розничные цены.
Oil Consumption Continues Slow Growth
Global demand for oil reached 85.7 million barrels per day in 2007, a modest 1-percent increase over the 84.9 million barrels consumed daily in 2006.1 (See Figure 1.) This marked the third straight year in which oil demand grew at an annual rate of less than 2 percent.2 Despite the slow growth in demand, oil prices rose from just above $50 in January to near $100 at year’s end—close to the all-time inflation-adjusted price record that was reached in the early 1980s.3
The United States continued unchallenged as the world’s single largest oil-consuming nation in 2007, using almost one fourth of the global total at a rate of 20.7 million barrels daily.4 But U. S. oil consumption was virtually unchanged for the third year in a row, as rising oil prices discouraged demand despite three years of steady economic growth.5
China increased its petroleum consumption by 5.5 percent in 2007, up from 7.3 million barrels per day in 2006 to 7.7 million barrels.6 It now accounts for nearly 9 percent of the world’s total oil use.7 Over the past decade China has nearly doubled its oil consumption, and the share of global oil used by all nations that do not belong to the Organisation for Economic Co-operation and Development (OECD) has increased from 37 percent in 1997 to almost 43 percent in 2007.8 Other top consumers in 2007 were OECD-Europe at 15.4 million barrels and Japan at 5 million barrels daily.9 (See Figure 2.)
The crude oil spot price in the United States averaged $72 per barrel in 2007, a 9.5-percent increase over the 2006 average of $66 and nearly triple the average price in 2002.10 The price of oil averaged over $90 a barrel in the final two months of 2007 and the first two months of 2008, nearing real dollar prices not seen since April 1980. On March 3rd, prices closed at $102.42, having set a new inflation-adjusted record high earlier during intra-day trading.11 (See Figure 3.) The U. S. Energy Information Administration (EIA) projects an average of $87 a barrel for 2008 as a whole.12
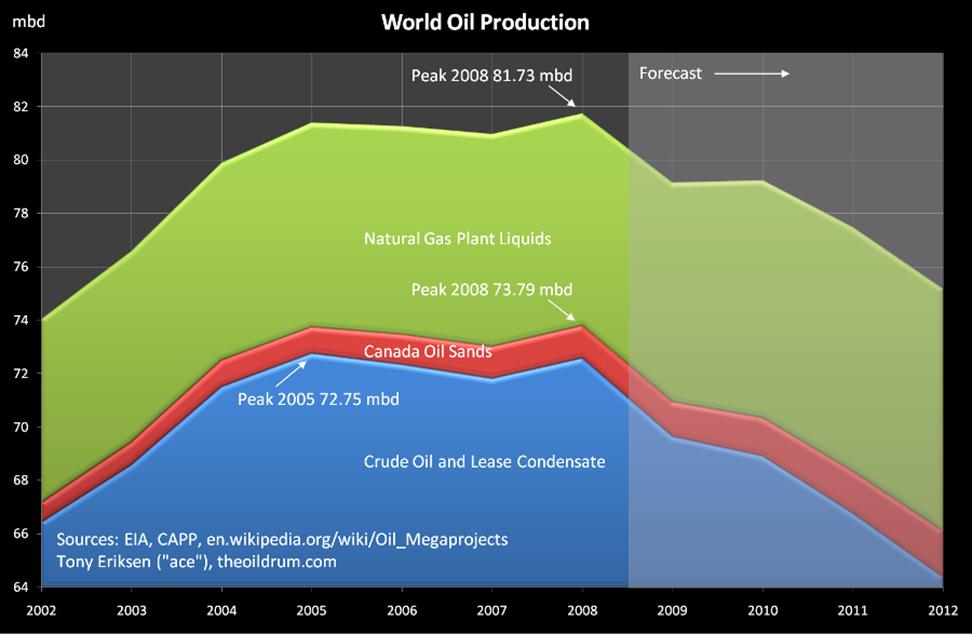
These high prices in the face of slowing demand growth have contributed to increasing recognition that limited spare oil production capacity has fundamentally changed world oil markets over the last several years.13 World crude oil production (without the natural gas liquids included in the consumption figures cited earlier) actually fell from 73.8 million barrels per day in 2005 to 73.2 million barrels a day in the first 10 months of 2007, according to EIA.14 This makes 2005 the peak year for world oil production so far, though it is too early to know if this will turn out to be the all-time high.15
In 2007, crude oil production declined in some of the world’s largest producers—including Indonesia, Mexico, Nigeria, Norway, the United Kingdom, and Venezuela—due to a combination of geological and political factors.16 Saudi oil production continued to fall in 2007—a voluntary pullback to accommodate a softening market, according to Saudi officials.17 By late 2007, however, Saudi production was 8 percent below the peak level reached in 2005, despite the fact that oil prices had risen roughly $20 per barrel since then.18 Uncertainty over the condition of Saudi oil fields and their ability to increase or perhaps even sustain current production levels is the single largest unknown facing world oil markets.
Meanwhile, crude oil production rose in 2007 in Angola, Brazil, Canada (mainly from tar sands), China, and Russia, which surpassed Saudi Arabia to become the largest producer.19 But production growth continues to slow in Russia, an ominous sign since that nation has been the most important source of production gains over the past decade.20
The fact that the world is having a hard time expanding oil supply fast enough to keep up with even modest growth in demand is beginning to be accepted in some corners of the oil industry. The CEO of Royal Dutch Shell and the U. S. industry–dominated National Petroleum Council have both stated that supply constraints are likely to put continued pressure on world oil markets in the years ahead.21 Although the dreaded phrase “peak oil” is still used mainly by oil industry mavericks like Matthew Simmons and T. Boone Pickens when discussing what lies ahead, their views—if not their language—do appear to be spreading to the mainstream.22
Political instability contributed to supply disruptions and price volatility throughout many of the world’s oil-producing regions in 2007. Iraq reached its highest level of oil production since the U. S.-led invasion in 2003, but this still remains below prewar production levels.23 In 2007, Iraq raised its production 5 percent over the 2006 figure, with gains in the latter half of the year coinciding with the 2007 “troop surge.”24 Overall, though, tensions in the Middle East remain highly charged and continue to factor heavily into world supply and price activity.
In Nigeria, despite a ceasefire signed by the government and eight rebel groups in December, the Movement for the Emancipation of the Niger Delta and other factions continue to wreak havoc on oil operations in the oil-rich southern delta.25 As a result of pipeline sabotage, kidnappings of foreign workers, and other risks, Nigerian oil production has decreased 15 percent from its summer 2005 peak to an average production of 2.1 million barrels per day in 2007.26 In Algeria, terrorist attacks targeting, among other sites, a United Nations office have also affected world markets and sparked concern among foreign oil companies operating in North Africa—a region considered crucial to future oil production.27
Thanks to skyrocketing oil prices, many oil companies again enjoyed record profits in 2007. Chevron Corporation posted a company-best $18.7 billion in profit, while Royal Dutch Shell PLC reported a near-best $31.3 billion.28 ExxonMobil Corporation, the world’s largest publicly traded oil company, posted a 2007 net income of $40.6 billion, the single largest annual profit in U. S. corporate history.29
The long-term future of oil companies may not be so bright, however. ExxonMobil reported a decline in oil and natural gas production in 2007, and many companies are finding it hard to replace their reserves.30 Not only have the largest oil fields already been developed, most of the promising prospect areas are controlled by state-owned oil companies, which hold 80 percent of the world’s proven oil reserves.31
Нефть подорожает до $70 за баррель ко второму полугодию 2009 года - Glencore
Цены на нефть вырастут до $70 за баррель ко второму полугодию текущего года на фоне сокращений квот ОПЕК, утверждает управляющий директор крупнейшего сырьевого трейдера мира Glencore International AG Марк Кэттон.

|
Из за большого объема этот материал размещен на нескольких страницах:
1 2 3 |
