

Партнерка на США и Канаду по недвижимости, выплаты в крипто
- 30% recurring commission
- Выплаты в USDT
- Вывод каждую неделю
- Комиссия до 5 лет за каждого referral
DRAFT 1
Design, Performance, and Calibration of CMS
Hadron Endcap Calorimeters
CMS HCAL Collaboration
Abstract
Extensive measurements have been made with beams of pions, electrons and muons on optical elements of the Endcap (HE) CMS hadron calorimeter. Data were taken both with and without electromagnetic calorimeter modules in front of the hadron calorimeter. The data were taken in the H2 test beam at CERN with particle momenta varying from 20 to 300 GeV. The time structure of the events was measured with the full chain of preproduction electronics running at 34 MHz and independently with a photo-multiplier and digital scope which recorded the calorimeter pulse in 0.4 ns steps. Moving-wire radioactive source data were taken for all scintillator layers. The measurements will be used to set the absolute calibration of the endcap hadron calorimeter prior to first pp collisions to approximately few percent.
1 Introduction
The CMS detector, presented in Fig. 1, is aimed at study of wide range of fundamental problems [1]. In order to cleanly detect the diverse signatures from new physics the identification and precise measurements of final state are needed. A final state of interest may contain all kinds of particles such as muons, photons, electrons, hadrons (or jets) and neutral particles
|
|
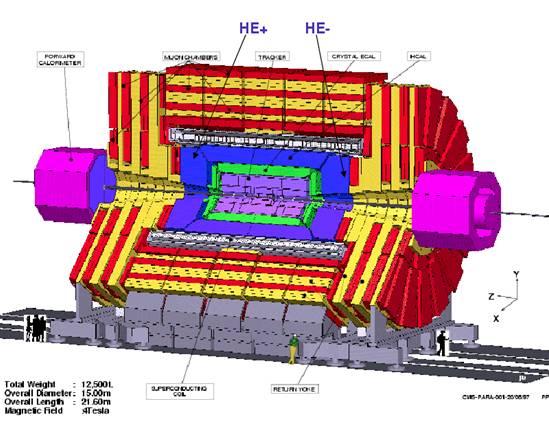
Fig. 1. General view of the CMS Detector. HE+ and HE - marks the Endcap calorimeters.
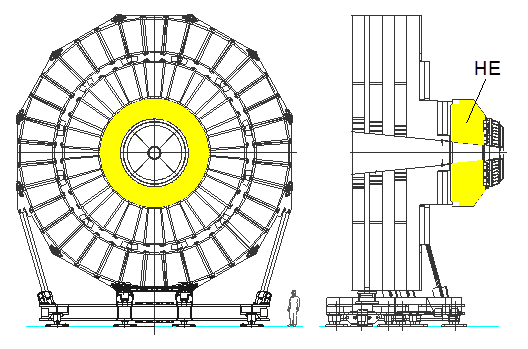
Fig. 2. Generic view of the hadron calorimeter moved out of the magnet.
(such as neutrino) which are detected by missing energy. For example, Higgs identification involves many different final states and branching ratios depending on its mass. Clean detection of all of these signals will imply that the detector must be capable of detecting almost any unexpected phenomenon.
For reliable identification of such events CMS is equipped with different detectors among which is the End cap hadron calorimeters – НЕ [2]. The solid angle of НЕ is only 13,2%, but the range of pseudorapidity covered by the calorimeter is from 1.3 to 3 that is very substantial part of all pseudorapidity range covered by calorimeters (0£h£5). The particle density is proportional to pseudorapidity range that is НЕ will contain about 34% particles in an event. The presence of НЕ is extremely important for events containing hadrons and jets in a final state, particularly for events with missing energy. High luminosity of LHC, which is required for realisation of the physical program, corresponds to large number of particles per event in the solid angle of HE. As a consequence a high counting rate and high radiation tolerance is a primary concern (calorimeter elements at small angles must withstand irradiation about 10 Mrad after 10 years of operation).
2 HCAL Endcap Design
The HE is a sampling calorimeter covering the pseudorapidity range 1.3 < η < 3.0. Because the calorimeter is inserted into 4 Т magnet solenoid the absorber must be made out from a nonmagnetic material but with maximum absorption length, good mechanical properties and minimal cost. A “cartridge brass”, 70% brass and 30% zinc was chosen.
As shown in Fig. 2 the HE is attached to the muon end cap yoke. Only a small part of the calorimeter structure can be used for the fixation because the major part of the space between HE and muon absorber is occupied with muon cathode strip chambers. To the forward part of HE a 10 tons electromagnetic calorimeter is attached with 2 tons preshower fixed to the front part of the electromagnetic calorimeter. Taking into account the HE weight (about 300 tons) and a strict requirement to minimise quantity of dead materials on the particle path the design of the HE is an unprecedented challenge to engineers. The new interface kinematics scheme was developed (in respect to the CMS HCAL Technical Design Report design) in order to provide a precise positioning in space of the endcap detectors, and first of all the First Muon Station, and to minimise the influence of deformations under the magnetic forces. The interface kinematics diagram provides a presence of a sliding joint between the interface tube, and HE back-flange and hinge connection between brackets and the disk YN1. Introduction of the interface sliding support into the design allows to reduce loads and, respectively, the stresses in the brackets, back flange and brass bolts. Hinge connection of the disk YN1 and bracket allows to reduce the stresses in a bracket and brass bolts as well as it allows to compensate for errors during an assembly of the disk YN1 and the flange. Structural materials of the interface system are not magnetic in order not to distort the induced magnetic fields up to 4 Tesla.
2.1 Absorber Geometry
The plates are bolted together in a staggered geometry resulting in a configuration that contains no projective dead material (see Fig. 3). The design provides a self supporting construction without “dead” zones and can be assembled (for control) and disassembled for transportation. The total length of the calorimeter (including electromagnetic calorimeter) is about 10 l. The spacing between the gaps is 79 mm of brass and the gap width is 9 mm. Because the energy resolution of HE will be limited by jet algorithm, fragmentation, magnetic field effects and energy pileup at high luminosity, minimisation of cracks (between HB and HE) and the absence of tails in the jet energy distribution are more important than a low value for the energy resolution.
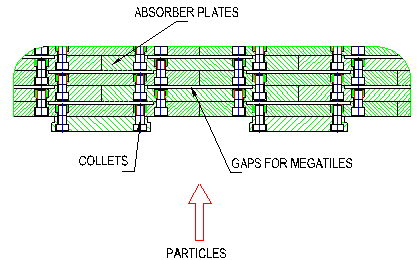 |
Fig. 3. Mechanical structure of HE absorber.
HE) and the absence of tails in the jet energy distribution are more important than a low value for the energy resolution.
 |
Last layers of the calorimeter are cut for installation of the photodetectors and front end electronics. To compensate the reduction of material a layer -1 is added to tower 16.
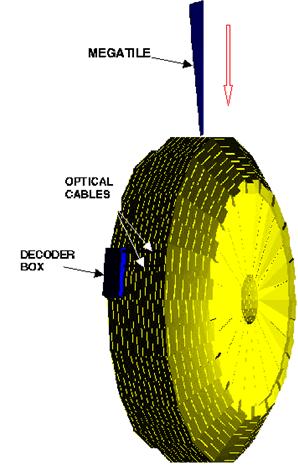
Fig. 4. Main elements of HE: absorber with shifted gaps for active elements – megatiles, megatiles and photodetectors connected with megatiles by optical cables
Last layers are fixed to a support stainless steel plate 10 cm thick. General view of the absorber is presented in Fig. 4. Optical elements are inserted into the gaps after the absorber is completely assembled. Therefore the optical elements must have a rigid structure to allow insertion in any position.
2.2 Scintillator
As the active elements scintillator is used the light from which is collected by wavelength shifting fibres. The method, proposed in [3], possesses a number of advantages in comparison with the other types of calorimeters: no “dead” zones, the light can be fed to any place (where photodetectors can be located), possibility to make absorber as solid piece without supporting structures that is very important for collider facilities. As shown in Fig. 5 the trapezoid scintillator 4 SCSN81 or 9 mm (Bicron BC408) thick has a grove or two groves with cross section of keyhole, in which a wavelength shifting fibre is inserted. The ends of the fibres are machined with a diamond flaying cutter and one end is covered with aluminium to increase the light collection. The other end is spliced to a clear fibre, which is terminated in an optical connector. The connector with the glued fibres is machined with flying diamond cutter.
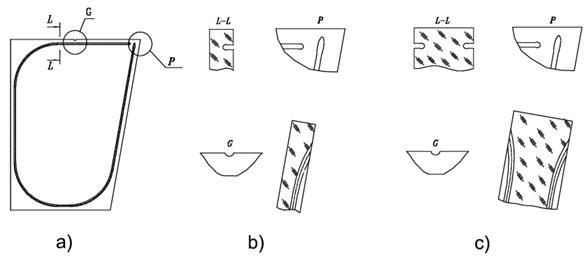
Fig. 5. a) The basic structure of scintillator (tile) with a groove to fix wavelength shifting fibre, b) the cross section of the 3.7 mm thick scintillator for 1-17 layers and c) the cross section of the 9 mm thick scintillator for zero layer. Two layers of reflecting paint cover the side surfaces of the tile.
The scintillator is painted along the narrow edges and put into a frame of so called megatile. The total number of tiles for both HE calorimeters is 20916 and the number of megatiles is 1368. The design of a megatile is presented in Fig. 6.
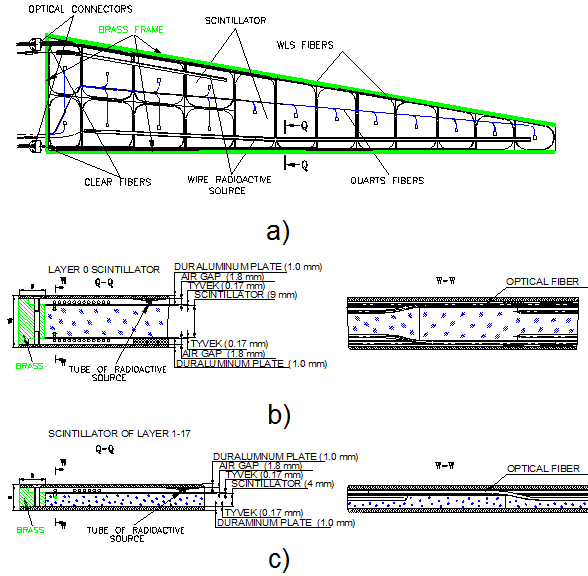 |
Fig. 6. Design of the calorimeter optical elements – megatiles: a) front view of the megatile tray without upper aluminium cover, b) cut out view of the zero layer megatile with two fibres from a tile, c) cut out view of megatile for layers 1-17.
As one can see from the cross section W-W, between duraluminum sheets 1 mm thick light insulating Tedlar film is placed then a sheet of reflecting Tyvek and then tiles. The tiles are covered by Tyvek with holes for fibers terminated with optical connectors. Above it other sheet of light insulating film is placed. The gap between the duraluminum plates is fixed by brass spacers screwed together. The granularity of the calorimeters is Dh´Df=0.087 for h<1.6 and Dh´Df»0.17 for h³1.6.
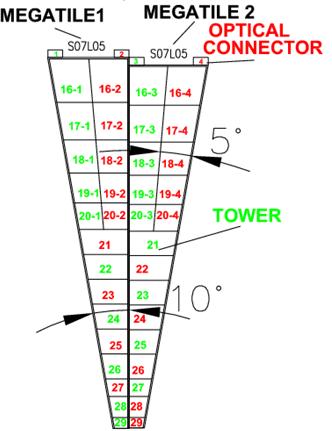
Fig. 7. Numbering scheme for the tiles in adjacent megatiles shifted in longitudinal direction on 44 mm.
The megatile design is very robust and reliable (damage of a tile does not lead to rejection of the whole megatile), relatively stiff that is very important for HE because the assemblage of megatiles into absorber will be at big height when HE is assembled.
To control megatile quality and the electronics UV nitrogen laser is used to excite the scintillators. The light is fed by quarts to the connector and is fan out by bundle shown in fig. 6 by violet color. These fibers are terminated by aluminum reflectors and distribute the light to all tiles. The light signal produced by UV flash in the scintillator is similar to the signal incited by a charge particle. In this way the performance of all recording rout starting from scintillator (possible degradation of transparency due to radiation damage) up to a final modules of electronics located in control room is checked. For the same purpose a radioactive source moving in a stainless still tube is used and transfer calibration coefficients obtained with fixed target beam to CMS.
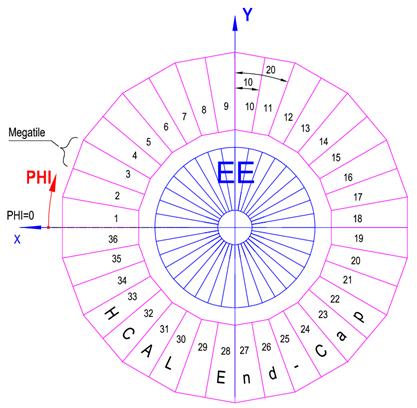 |
Fig. 8. Numbering scheme for the megatiles. X is directed inside of the LHC. View from Interaction Point.
The megatiles are inserted into gaps in absorber as shown in Fig. 4 and fixed by screws. At the backside of the calorimeter in the cut of absorber boxes with photodetectors and electronics are located. Optical cables transfer optical signals from megatiles to these boxes.
Multipixel Hybrid Photo Diodes are used as photodetectors due to low sensitivity to magnetic field, high gain and large dynamical range (~104).
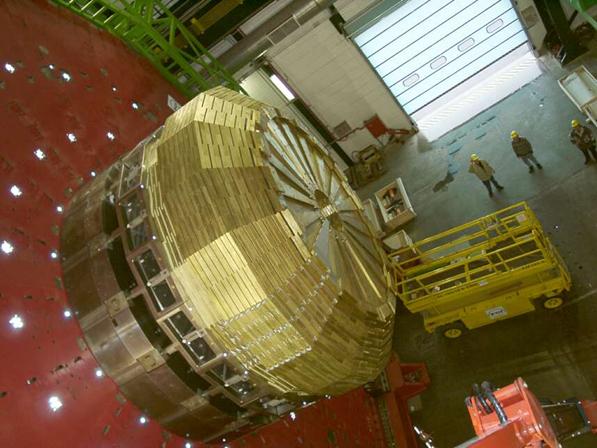
Fig. 9. Assemblage of HE - in SX5. Megatiles are inserted only in 9 hour 200 sector.
2.3 Longitudinal Segmentation
Longitudinal segmentation of HE, presented in Fig. 10, is defined by radiation environment – requirements to correct calibration coefficients after the scintillator degradation to restore the energy resolution. Therefore the tower close to the beam (the 28th one) has transverse division (29 and 28) for 5 layers and 3 divisions in depth (layers of the different colors are read separately).
The first 4 layers (1-4) are supposed to be used also as the electromagnetic calorimeter during the time period when it is not available. The zero layer is installed in front of absorber to measure energy flow between EE and HE to correct the different response of EE to electrons and hadrons and particle absorption in mechanical structure supporting EE.
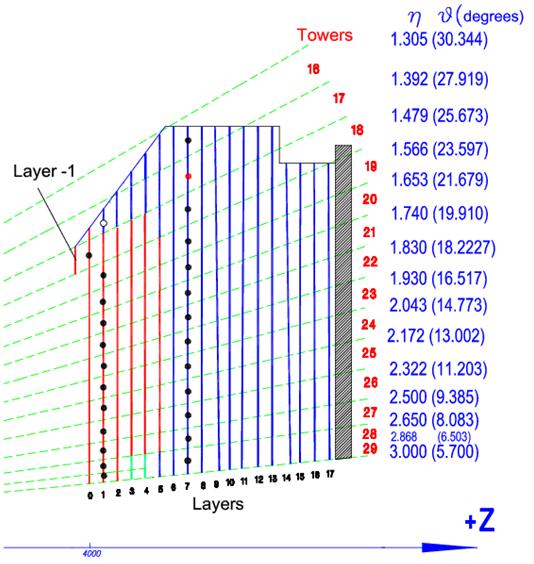
Fig. 10. The longitudinal and transverse segmentation of the calorimeter. The coloured lines indicate the scintillators. Green dotted lines are directed to IP.
3. Test Beam Setup
The megatile characteristics were studied with absorber prototype presented in fig. 11 installed on the CERN H2 test beam. The sector was positioned on a rotating table providing the tower irradiation in j and q. The two-dimensional movement of the platform shown in fig 12 allowed the beam to direct the beam onto any desired location in (θ, j) space. The position of the platform was measured electronically and recorded in the data stream. The detector response provided an accurate calibration of the detector position with respect to the beam.
The beam line was equipped with four 1cm thick scintillator counters for triggering and two sets of wire chambers to monitor the event-by-event
During muon scan the light from an irradiated tower was collected on a single phototube type FEU 85. The light from zero layer was fed to a separate phototube FEU 85. During pion scan light from 4 towers (19 and 20) was collected to a phototube RCA 8579. Besides light from the 21 tower was fed to a separate FEU 85 to estimate transverse shower leakage. The beam was positioned at the center between towers 19 and 20 .
There was additional information from muon counter placed behind HE.
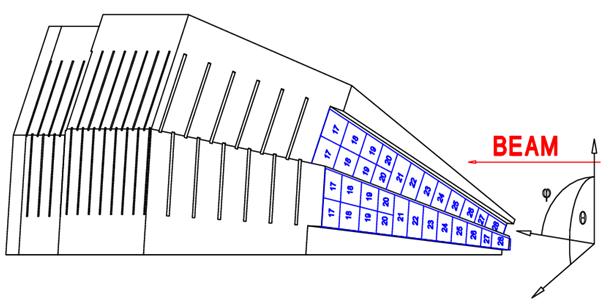
Fig. 11. General view of HE hadron calorimeter prototype sector. L0 layer tower numbering is shown.
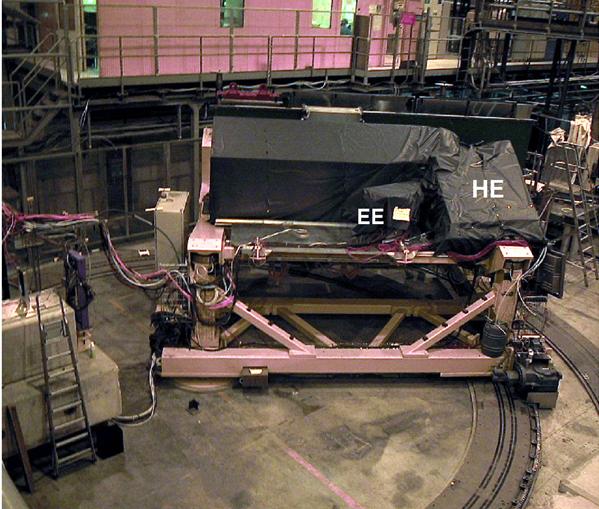
Fig. 12. HE Prototype and the electromagnetic calorimeter (EE) mounted on the moving platform.
4. Energy calibration of the hadron calorimeter
The energy calibration consists of the measurements of a relationship between ADC channels and the calorimeter amplitude irradiated by 20-300 GeV hadrons. At the analysis stage the events with muons were rejected, there were also requirements that the distance between the beam center and particle trajectory must be in the rage from +5 to -15 and the difference of the coordinate in the first and the second chambers must be less than 3 mm.
The leakage from the calorimeter in the transverse direction was estimated using information from the 21 tower. The amplitudes from the tower were added to the amplitudes from the main part of the calorimeter. The relative weight of this tower was optimized to obtain the best energy resolution.
From these measurements the energy per channel was estimated as 0.11 GeV/channel and with muon beam there was measured the muon energy release in the calorimeter as 3.53 GeV.
The coefficient of the relationship between the channel number and energy response was defined by normalizing 300 GeV pion beam release from 4 towers without taking into account the response of the 21 tower. Fig. 13 shows the dependence of the energy resolution on the beam energy described by function  with stochastic term А ≈ 102% and constant term B≈ 2.7%.
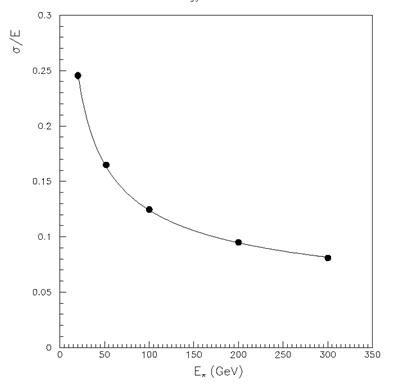
Fig. 13. Energy resolution dependence of the hadron calorimeter on beam energy.
5. Calorimeter pulse duration
Pulse duration of the end cap hadron calorimeter defines its operating speed. There are the following contributions:
1. time decay of scintillator which equals to 5 ns for SCSN scintillator produced by Kuraray;
2. time of re-emitting wave length light which equals to 11 ns for Y11 produced by Kuraray;
3. difference of optical length from tiles to photodetectors for a tower (the estimated value is 1 ns with time-of-flight taking into account);
4. pulse duration from scintillator defined by time collection of slow neurons from hadron shower.
For this study FEU 85 was used with intrinsic pulse length 10 ns. The muon pulse length from 17 layers and pulse length from a single scintillator induced by UV laser pulse (~5 ns duration) are approximately the same (about 30 ns) that support the estimate made in item 3. The hadron pulse length is about 200 ns that seemingly is defined by collection time of slow neutrons. Thus the duration of the calorimeter signal is defined in generally by the material of the absorber.
6. Muon signal
Fig. 14 presents the pulse height distribution of muon signal from L0. Solid line shows the distribution fitted to Poisson - Gauss – Landau convolution. From this distribution the estimated number of photoelectrons in peak is 13. Taking into account that one ADC count is equal to 3.7 fС we have 10.4 fC/photoelectron. Muon signal from a tower corresponds to 55 photoelectrons. A tower consists of 17 scintillator layers, thus, a single layer produces 3.2 p. e.
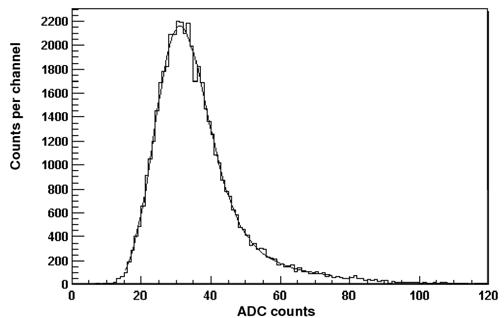
Fig. 14. Muon pulse height distribution from L0.
7. Study of combine calorimeter characteristics (HE+EE+L0)
The combine calorimeter consists of electromagnetic calorimeter, hadron calorimeter, and zero layer L0 placed in front of HE to correct energy fluctuation of hadron shower in EE. Because the ratio e/π is bigger for EE than for HE this leads to considerable degradation of energy resolution of the combine calorimeter in comparison with the HE energy resolution alone.
For these measurements an electromagnetic calorimeter made of lead glass SF5 from experiment WA91 was used [4]. The calorimeter has dimensions 14 x 14 x 47 cm3 that corresponds to 18.5 radiation lengths. Light was collected at a phototube XP-2050. The energy resolution of the calorimeter obtained by WA91 collaboration is described by expression s(E)/E = A/√E Å B, where A = 5.8 ´ 10-2 and B = 1.4 ´ 10-2. Response of the calorimeter depends linearly on electron energy. The energy response of the combined calorimeter was calculated according to the following expression:
E = W1 ´ EE + W2 ´ HE + W3 ´ L0 + W4 ´ TW21,
where TW2 stands for signal from the 21 tower adjoining the towers used for hadron shower measurements, EE, HE and L0 corresponds to electromagnetic calorimeter, hadron calorimeter and zero layer signal amplitudes. The weight W2 for hadron calorimeter signal was chosen equaled to 1, other weights were free parameters optimized for each energy beam to minimize the energy resolution s(E)/E. The term W4xTW21 in the above expression is the effective estimate of transverse leakage of hadron shaver. Additionally using information from the laser control system the nonlinearity of phototubes was corrected for each part of the combined calorimeter. The total response of the combined calorimeter is presented in fig. 15 for 300 GeV pion beam which is close to normal one that is the evidence of correctness of the applied corrections.
The energy resolution of the combined calorimeter is presented in fig. 16, solid line is the fitting by the expression s(E)/E = A/√E Å B, where the stochastic and constant terms are summed up in quadratically. The fit parameters are A=1.53 ± 0.04 and B=0.063 ± 0.005.
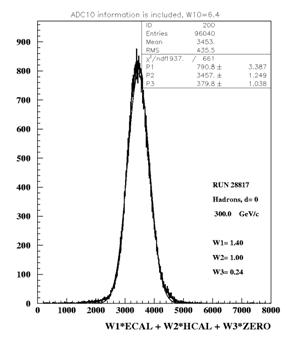
Fig. 15. Pulse height distribution from the combined calorimeter.
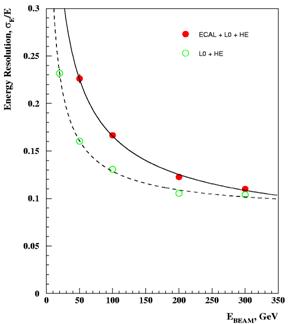
Fig. 16. Energy resolution dependence of the combined calorimeter on the beam energy.
8. Calculation of the optimal weight for L0
Energy dependence of the combined calorimeter on the weight of L0 is presented in fig. 17 for beam energy 50, 100, 200 and 300 GeV. The weight for HE was chosen equal 1 as before. Besides the difference of the phototubes gain was taken into account which was measured by a single phototube with muon beam for each part of the combined calorimeter. As one can see from fig. 17 the optimal weight of the L0 varies within small range with beam energy and the average meaning of the coefficient is about 0.23. This value can be used for passive (optical) summing up of the signal from L0 with HE signal. not to increase the number of electronic channels. It is necessary to take into account that the characteristics of the electromagnetic calorimeter used for this measurements differ from the CMS electromagnetic calorimeter therefore the obtained weight must be considered as an estimate.
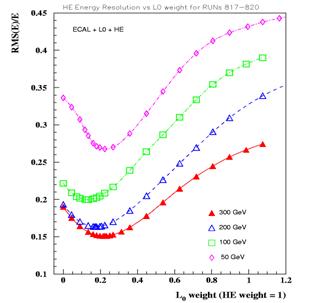
Fig. 17. Energy dependence of the combined calorimeter on L0 weight.
It also necessary to mention an alternative method to sum up energy release [5]. The gist of the method is to use the information about transverse dimensions of a hadron shower in electromagnetic and hadron calorimeters. for a combined calorimeter energy resolution of which becomes close to the one of the single hadron calorimeter.
9. Estimation of the photoelectron number in HE and L0
Using the obtained ratio between the number of photoelectrons and energy scale in GeV for muons an one can evaluate the number of photoelectrons per GeV in HE ( n=15.6) and in L0 (n=53). Taking into account the charge per one photoelectron estimated earlier we have estimation of a charge per GeV for HE (162 fC) and for L0 (557.4 fC). For 300 GeV pion beam we have the energy release in L0 (30.9 GeV) and in HE (142.6 GeV) 2225 photoelectrons in HE (23,1 pC) и 1656 photoelectrons in L0 (17,2 pC). Comparatively large number of the photoelectrons in L0 is due to large thickness (9 mm in comparison with other layer), two (one in other layers) sigma loops of WLS and position of L0 in the maximum of the hadron shower. Therefore the photoelectron number fluctuations will not contribute substantially to energy resolution of the hadron calorimeter even after optical suppression of L0 signal to 0.23 times.
10. Study of influence of a material situated between electromagnetic and hadron calorimeters
The CMS calorimeter contains construction material to fasten EE to HE. To study the influence of these structures on the energy resolution of the combined calorimeter there was placed an aluminum bar with cross section 25 x 25 mm2 and 150 mm long along the beam. The supporting structures between the EE and HE will not exceed the bar dimensions and corresponding quantity of matter. The bar moved perpendicular to beam. The observed decrease of the HE response when the bar is put into beam is completely compensated increase of L0 response. The total response of the combined calorimeter did not changed within the measurement errors.
11. Study of HE performance
The HE prototype (HCAL) characteristics study and calibration were performed with phototubes. When the final electronics and photodetectors (HPD) were finalized new test of HCAL became inevitable.
The electromagnetic calorimeter used to measure the combined energy resolution was made of a lead glass instead of lead tungstate. So when such calorimeter became available it also required new measurements.
For more reliable MC calculations the response of the HCAL to low energy hadrons is important. Therefore a wider range of energy scan must be required.
There was also completed production of light control system that required a test with HCAL. All these factors initiated the new test beam.
12. Layout of the measurements
The megatile characteristics were studied with absorber prototype presented in fig. 11 installed on the CERN H2 test beam. The sector was positioned on a rotating table providing the tower irradiation in j andq.
Four scintillation counters of size 14x14, 4x4, 2x2, and 14x14 cm2 were located approximately three meters upstream the ECAL module. A coincidence between the 2x2 and one of the 14x14 counters was used for the trigger.
Beam chambers positioned in front of HE to measure particle trajectories and a muon counter placed behind HE. In part of the measurements in front HCAL there was placed ECAL with 49 PbWO4 crystals, [6] each of size 2.2x2.2x23 cm3, arranged in a 7x7 block. The crystals are tapered so that they have a slightly smaller upstream cross section. On the end of each crystal, a plastic light guide sent the light produced in the crystals to 49 separate photomultiplier tubes (Hamamatsu R7524). The light guides are located on the front end of the crystals. There is the 12.3 cm between the end of the crystals and the end of the box. The space includes a 7 mm aluminium plate that holds the crystals in place. The aluminium block corresponds to approximately the same amount of material that will exist in CMS between the crystals and the HCAL. The distance between the fixation point and the aluminium block is 10.5 mm. The PMT signals were converted to ADC counts using V972 charge-to-digital converters (QDC). Five thermocouples were distributed inside of the aluminium box for temperature monitoring.
Megatile performance was controlled by radioactive source tubes and light control system. Final HPDs and electronics were used for the measurements. The HCAL was exposed to:
- 5, 9, 100 GeV electrons;
- 5, 9, 50, 100, 150, 300 GeV pions;
- 150 GeV muons.
The HE+ECAL was exposed to:
- 50, 100 GeV electrons;
- 30, 50, 100, 150, 300 GeV pions;
- 150 GeV muons.
According to the measurements 99% of the HCAL signal could be contained in 4 25 ns time slices but due to delay spreading about 15 ns (see fig. 18) the events were analyzed in 5 time slices. Fig. 19 shows the total distribution of pedestals in 5 time slices for a single tower with s=0.38 GeV. Variation of the mean during the measurements was less than 0.1%. Similar distribution is presented in fig. 20 for 49 ECAL crystal pedestals with s=2.22 GeV.
Fig. 20 shows pulse height distribution for electrons obtained from ECAL and fig. 21 illustrates muon pulse height distribution. It is very similar to one obtained with PM that is the evidence that new electronics (HPD, QIE) does not introduce additional noise.
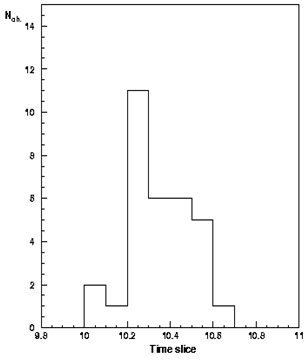

Fig. 18. Time spreading of delays in different channels.
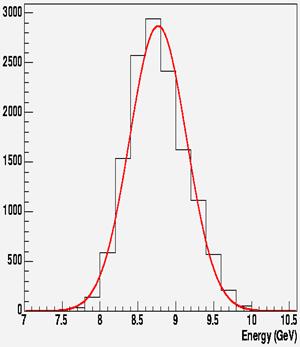

Fig. 19. Total distribution of pedestals in 5 time slices for a single tower.
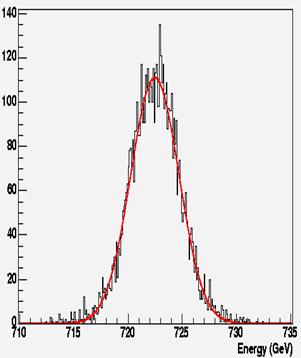

Fig. 20. Total distribution of 49 ECAL crystal pedestals
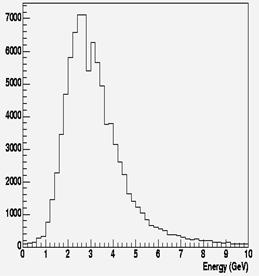

Fig. GeV muon pulse height distribution for both parts of HCAL.
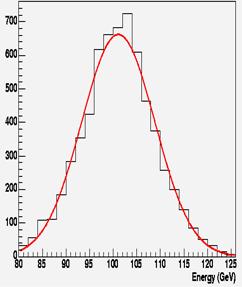

Fig. 22. HCAL pulse height distribution for 100 GeV/с electrons used for absolute НЕ and ECAL calibration.
13. Electronics and Data Acquisition
Figure 23 shows an overview of the HCAL electronics and data acquisition planned for the CMS experiment. The key elements tested during these measurements were 1) front end electronics at 34 MHz with gigabit optical link (GOL), 2) HCAL trigger and readout (HTR) cards with channel links, 3) data concentrator (DCC) with SLINK 32, and the LHC trigger, timing and control (TTC) clock.
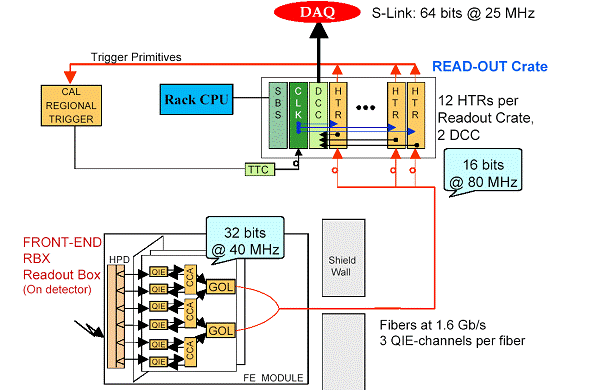
Fig. 23. Overview of the HCAL data acquisition electronics.
14. Study of energy response of the calorimeters
Because the HE prototype has limited transverse dimensions (only two 100 sectors) there was an appreciable probability of transverse shower leakage. Therefore the measurements must be corrected for this effect. To do so the value of the leakage was estimated by measuring the ratio (E16 – E9 )/E16 presented in fig. 24. Here indexes mean 16 towers summation and 9 towers summation. with and without ECAL. From these measurements the energy leakage can be determined.
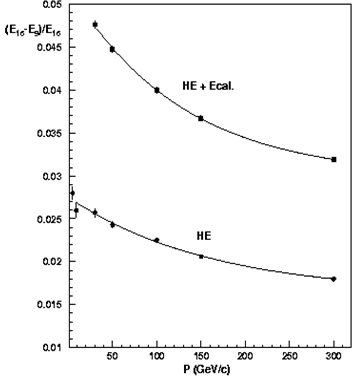

Fig. 24. Pions energy was defined using,19,20,21x4) and 9 (19, 20, 21x3) НЕ towers. The signal difference was used to estimate the transverse energy leakage.
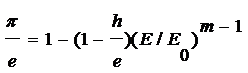
The pion response was corrected for longitudinal and transverse energy leakage. An important characteristic of the calorimeter is p/e ratio which is described by the expression:
 |
,
For НЕ е/h=1.216±0.005, m=0.823±0.002, E0=1.24±0.17. For combined calorimeter - НЕ+ECAL е/h=1.469±0.019, m=0.680±0.004, E0=3.46±0.33. Fig. 25 shows this ratio in dependence on particle momentum for two cases.
Fig. 26 shows the relative difference of the pulses between all events and m. i.p. pulses from the forward part of HE. The solid line is MC calculation based on use of longitudinal shower shape for different energies. For HE the longitudinal leakage is in the range 0.1 to 1 % for pions energies from 30 – 300 GeV.
The energy resolution of the calorimeter is described by the following expression:
 |
|
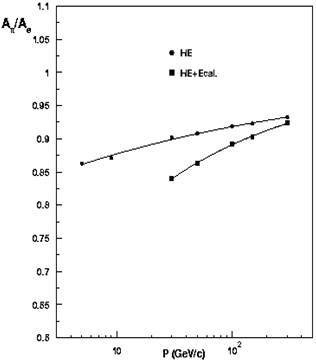

Fig. 25. p/e ratio for hadron calorimeter without ECAL (·) and with ECAL (■).
where s ped is the contribution of pedestal width to the resolution. This value was quadratically subtracted from the resolution. The final figures for the calorimeters are the following:
НЕ (pions) S=1.061±0.004, C=0.040±0.001
НЕ+ECAL (pions) S=1.188±0.006, C=0.040±0.001
НЕ (e-) S=0.670±0.004, C=0.029±0.002
Fig. 27 demonstrates the dependence of the energy resolution for these three cases in dependence on particle momentum.
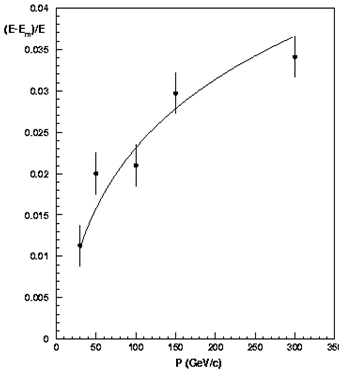

Fig. 26. Ratio of total pion energy minus minimal pion energy released in the first part of HCAL to total pion energy in dependence on pion momentum. The solid line is MC calculation using longitudinal hadron shower distribution for different energies.
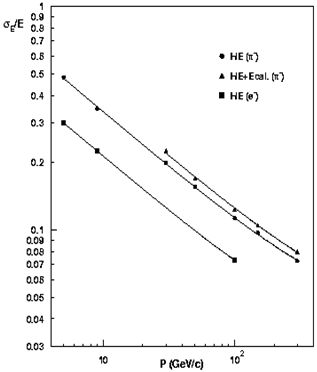

Fig. 27. Calorimeter energy resolution in dependence on particle momentum.
15. Spatial resolution of the HE prototype
Spatial resolution of pion showers was measured without ECAL in front of the HE prototype. Experimental data includes scan at pion energies 50, 100, 200 and 300 GeV for phi region form -2.5 to +2.5 degree at fixed eta (tower 19) as shown in Fig.28.
|
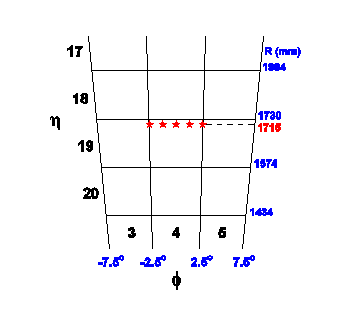
Fig. 28. Scheme of front part of the HE prototype specified tower numbering in eta- and phi-directions, phi-coordinates of tower borders and R-coordinates in mm. Stars show positions of exposed sports by pion beam.
Phi position in degrees was measured by centre of gravity of shower in 3x3 towers and compared with the position of primary beam pions on the front face of HE measured by the beam chambers. Fig. 29 shows phi resolution vs. phi coordinate of beam pions at energy of 300 GeV. The best resolution corresponds to the pion position in between of towers at phi=+-2.5 degree and the worse case – to the middle of tower at phi=0 degree.
Dependence of phi-resolution on beam energy at fixed positions of beam pions at phi=0, 1.25 and 2.5 degrees is shown in Fig. 30. Energy dependence of phi-resolution is described by equation s=a+b/√E. Phi resolution of pion shower changes from 5% to 20% of tower phi-dimension at different pion position and energy.
|

Fig. 29. Phi resolution of pion showers across the tower 19 for 300 GeV pions.
|
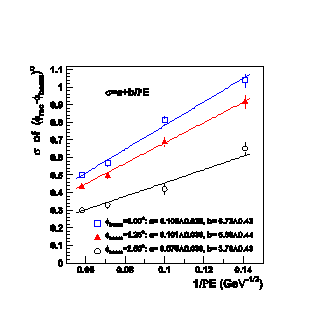
Fig. 30. Phi-resolution of pion showers vs. energy and its approximation for various positions of beam pions.
16. Radioactive Source Calibration
Each tile of all megatiles was irradiated by wire radioactive source to control megatile optical characteristics. There was measured average value of the signal for 4 time interval. Fig. 31 shows these values for moving in forward direction (green color) for one tile.
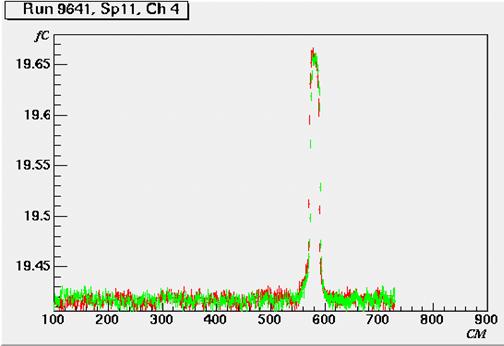

Fig. 31. Radioactive source signal for one tile.
The average value of the signal was determined for these two signals and the full width of the signal at high height was calculated. The pulse height was calculated in the range of the plateau (see fig. 32). Fig. 32 shows MINBIN and MAXBIN which are the half distances from the center of the distribution (CENTER) to the left and the right boundary. Fig. 33 presents the signal of the radioactive source from the center tower (front part η=19 φ=4) in dependence on η for different φ. Because the wire radioactive source depends on the tile dimensions a corrections was applied taking into account the ratio of the collimated radioactive source to the wire source. Particles from collimated source hit the scintillator perpendicular. High energy particles enter the scintillator at some angle. It was taken into account by a correction on this angle (cosq). The ratio of the wire source to muon signal for the second part of the HE is presented in fig. 34.
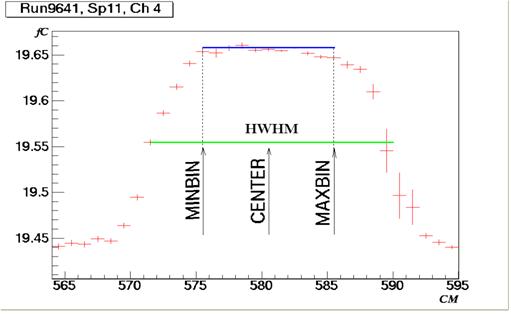

Fig. 32. Calculation of the radioactive source pulse height.
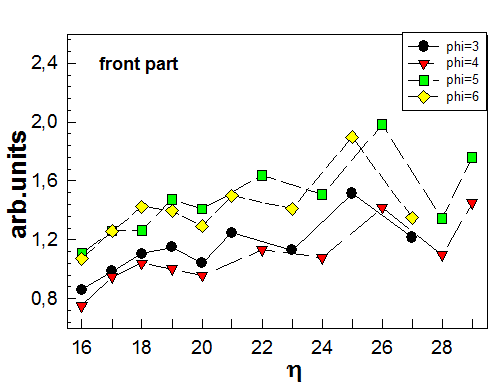
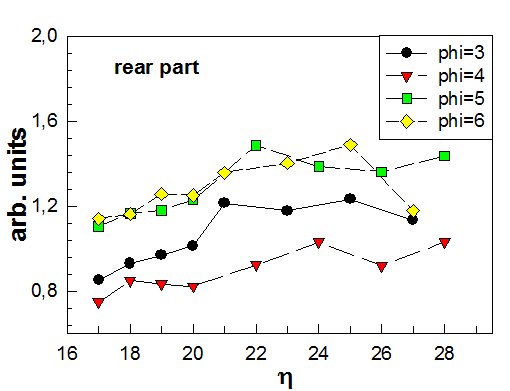
Fig. 33. Radioactive source signal with respect to central tower (front part η=19 φ=4) for front and rear parts of HE.
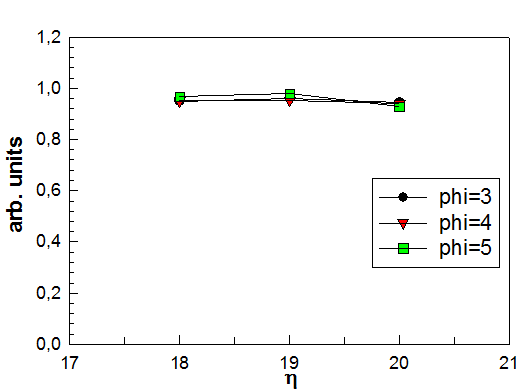
Fig. 34. Ratio of radioactive source signal to muon signal for rear part of HE.
17. Light control system
It was the first time that the light control system was completely assembled. The system, layout of which is presented in fig. 35, consists of the light emitting diodes (LEDs) and ultraviolet nitrogen laser and can be switched on in turn. The LED system illuminates HPD and allows to control the absolute time position of the pulses in each channel and provides the fast qualitative control of all chain starting from HPD.
When the control system is switched to the laser the laser pulses pass through a filter rotor and part of the light goes to PIN diode to control the stability of the laser performance, the other part of the pulse can be fed to WLS and green light illuminates each pixel of all HPDs. The pulse height of these distributions normalized to PIN 1 diode pulse amplitude defines stability of performance of all chain starting from HPD. If the laser pulse is switched into another position then light goes to megatiles. Fig. 10 shows by circles (black, white and red) the tiles which are illuminated by laser. Light is transported to megatiles by quarts fibers and there it is fanned out and one feeds the pulse to WLS and then to PIN 2 diode to control the stability of the quarts loop and the light transmission chain (optical cables from the laser, optical cables to megatiles). The other fibers feed the light to the tiles to control radiation stability of the scintillator and performance of the whole detector. Fig. 36 shows HPD pulse height distribution from WLS illuminated by laser (not normalized to PIN 1 diode). Fig. 37 shows the same distribution normalized to PIN 1 diode. Fig.38 presents the pulse height distribution of a tile illuminated by laser. Fig 39 shows pulse height distribution from PIN 2 diode (from quarts loop). HPD pulse height distribution from laser in dependence on rotor position is presented in fig. 40. Open circles are data with pedestal subtracted. Nonlinearity of the system in the range () fC is less than 1%. Saturation starts at 104 fC due to QIE. Fig. 41 shows time position and distribution of HPD pulses from laser, time synchronization was made from laser.
Fig. 42 shows the mean HPD pulse height values during the run. The stability of the performance is 0.3%.
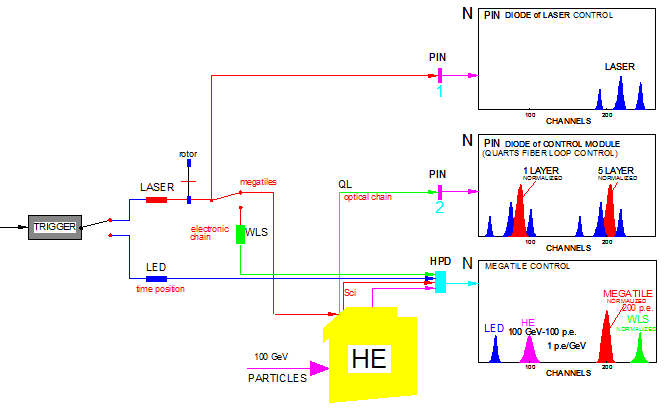 Fig. 35. The layout of optical control system.
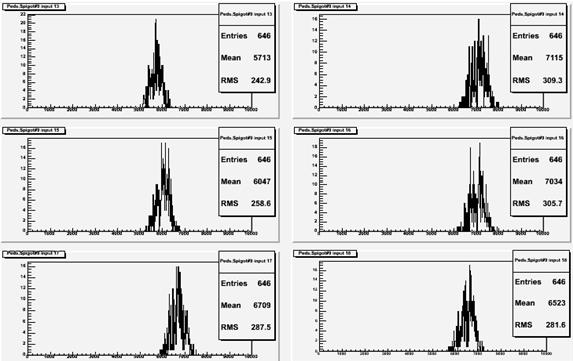

Fig. 36. Pulse height distribution from HPD illuminated by laser.
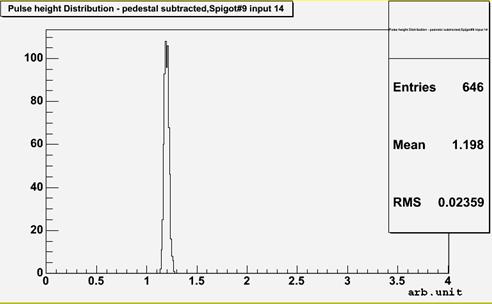

Fig. 37. HPD pulse height distribution normalized on PIN diode.
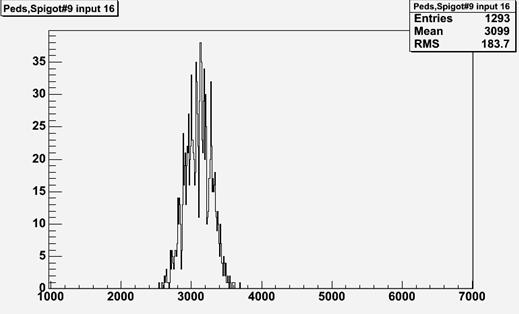

Fig. 38. Megatile pulse height distribution.
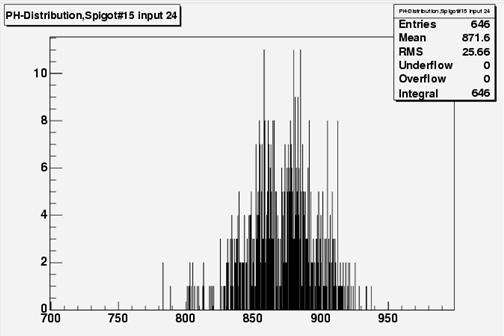

Fig. 39. PIN signal from quarts loop.
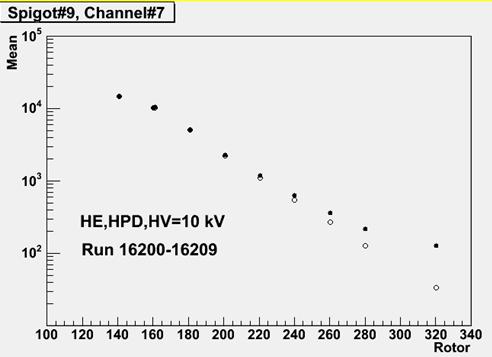

Fig. 40. HPD signals from laser in dependence on filter position. Open circles are data with pedestal subtracted.
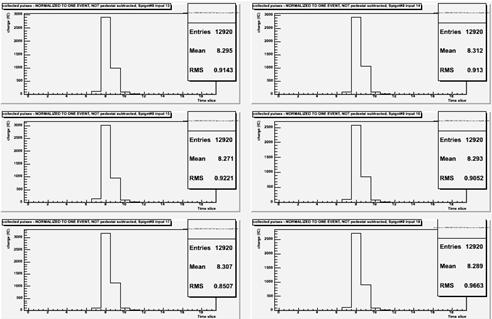

Fig. 41. Time position and distribution of HPD pulses from laser.
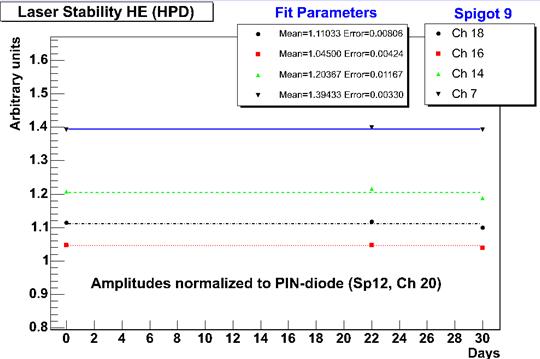

Fig. 42. Mean HPD pulse height values due to illumination by shifted laser light during the run.
Conclusion
The measured relationships between the energy release of radioactive source, muons, and hadrons will allow to define the energy scale of the HE after final installation of CMS.
The pulse length from the hadron calorimeter is determined by the time collection of slow neutrons that in its turn is defined by calorimeter absorber.
Taking into account the information from a scintillation counter placed between the calorimeters the nonlinearity of the combined calorimeter is restored for single hadrons.
Introduction of a constructive element up to 40 g/cm2 in front of the hadron calorimeter does not degrade it energy resolution appreciably.
Performance of the calorimeter with final photodetectors and electronics shows no deterioration of the characteristics in comparison with standard electronics and phototubes.
The first test of the complete laser control system was successful.
Test with real EE prototype would be desirable.
Additional study of the light control system performance is required to optimize the data analysis.
Acknowledgments
In conclusion the authors consider their pleasant duty to thank V. A.Polyakov for providing of the electromagnetic calorimeter.
References
[1] “CMS Technical Proposal,” CERN/LHCC 94-38, LHCC/P1 (December 1994).
[2] “CMS, The Hadron Calorimeter Technical Design Report,” CERN/LHCC 97-31 CMS TDR 2 (June 1997).
[3 V. I. Kryshkin and A. I. Ronzhin, Nucl. Instr. Meth. A
M. G. Albrow et al., Nucl. Instr. Meth. A
[4] S. N. Malyukov et al, Preprint JINR P, 1995.
[5] D. Alde et al., Nucl. Instr. and Meth. A268(19; F. G.Binon et al., Nucl. Instr. and Meth. A269(19
[6] P. Sopicki, P. de Barbaro, R. Kellog et al. CMS IN 2004/033.
[7] V. Konoplianikov et al. CMS IN 2006/0XX – in preparation.
