

Партнерка на США и Канаду по недвижимости, выплаты в крипто
- 30% recurring commission
- Выплаты в USDT
- Вывод каждую неделю
- Комиссия до 5 лет за каждого referral
Dynamic behaviour of WWER 1000/320 reactor fuel assemblies
and influence of main circulating pump pressure pulsations
P. Stulнk
Nuclear Research Institute, Rez, Czech Republic
Annotation: The evaluating of changes in fuel assemblies dynamic behaviour is particularly needed
and required. Self power neutron detectors installed in reactor fuel assemblies can hold important information about vibration in spite of complex surrounding influencing signal output by many parameters. The paper deals with the analysis of available set of self power neutron detectors to show influence of main circulating pump excitement forces.
Key words: Reactor vibration, pressure pulsations, fuel assembly, fuel rod, self power neutron detector, power spectral density, transfer function, time domain, frequency domain, joint time frequency domain, beat frequencies.
1. Introduction
In the past many start-up and operational measurements of pressure vessel and internals vibrations of both VVER 1000/320 NPP Temelin reactor units have been performed. These measurements included pressure sensors (TP), accelerometers (ACC), ex-core ionisation chambers (XNN) and self-powered neutron detectors (INN). The measurement data sets were originated
from several diagnostic systems – operational diagnostic system RVMS (the part of in-plant diagnostic system TDMS delivered by Westinghouse, USA ), start-up special system ANALOG (implemented by ЉJS start-up supplier– [1], [2]) and system DMTS (developed by NRI Rez for the distributed acquisition of large volumes of data, their relevant processing and evaluation in
the different domains primarily by means of noise diagnostics ([3]).
In [4] the accelerometers installed on the flange of reactor pressure vessel have been used
for measurement, the evaluated significant frequencies were compared with the exciting ones and
the good agreement was indicated.
The influence of the NPP Temelin reactor operational vibrations on the core barrel stability was investigated in [5] by means of the developed 3D mathematical reactor model and evaluated measurement results under the condition of full MCPs operation with slightly different revolving frequencies.
Some following works were further conducted ([6] - [7]) in which the dynamic responses of NPP Temelin reactor in full and less loop main circulating pump combinations were examined on reactor models and experimentally verified.
With the Gidropress experience in the area of reactor internals and fuel vibration research published in ([9], [12]) on mind, the NPP Temelin new fuel elements project ([10]) has been initiating the solution of further investigations ([13], [14]).
2.
|
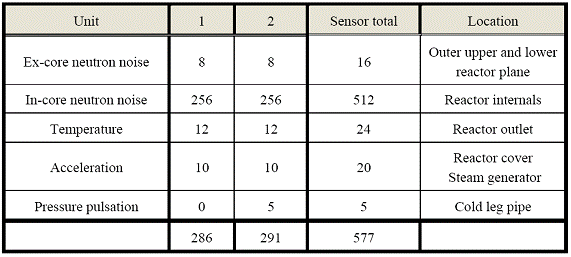
In-plant system RVMS delivered by Westinghouse and described in [1] or [2] has being used not only during both units commissioning tests (2000, 2002) but then primarily in the normal plant operation. It features 12 bit amplitude resolution in six frequency ranges up to 200Hz with 0.5 Hz frequency resolution and 1 kHz sampling frequency enabling thus measurements of 4 accelerometers ACC on the upper reactor flange, 6 accelerometers ACC on the steam generator (Unit 1), 8 ionization chambers XNN in upper and lower positions, 5 pressure fluctuation sensors PFT (only Unit 2) placed on cold loops, 12 reactor output thermocouples, 256 self powered neutron detectors INN measured
in 16 groups just as it is shown in Table 1.
The Љkoda system ANALOG was used during both units commissioning tests on set of specially arranged sensors. Measurement was accomplished with 12 bit amplitude resolution, with variable frequency domain resolution 0,1 – 0,5 Hz and 1 kHz sampling frequency.
The NRI Шeћ system DMTS has been applied in various stages of both units operation
by acquiring and processing extensive time records with 24 bit amplitude and selected 0,122 Hz frequency resolution with 1kHz sampling frequency.
It is worthwhile to note in this context that there are important issues for diagnostic investigations especially for the case of actual or anticipated operational events with known implications but with unknown causalities
- it is necessary to have a well arranged frequency domain results (APSD, CPSD, COH, PHASE etc.) with pertaining operation parameters enabling comparison of similar reactor units
- the existence of sufficient time records is necessary for more detailed processing
and evaluation.
3.
|
There are three main types of reactor internals exciting forces – pressure pulsations generated
by main circulation pumps (MCP), pressure pulsations in turbulent boundary coolant flow layer
in the core barrel - reactor pressure vessel gap and the acoustic pressure sources in the primary circuit coolant.
The analysis of reactor pressure vessel vibration was fulfilled in [4] and [5]. Four piezoelectric accelerometers (0.5 – 300 Hz) installed on reactor cover had been measured at nominal 100% power with enhanced amplitude resolution by system DMTS. The acquired signals were processed
in frequency range of 0.5 – 100 Hz. The used 3D mathematical reactor model with 137 degree of freedom was tuned in by means of measured operational frequency 18.738 Hz.
The analysis summary is as follows
- authors classified the set of frequencies 6.714, 13.57, 33.05, 53.386 Hz as the operational acoustic frequencies with the assumption that the corresponding pressure fluctuations cause forced reactor vibrations
- the frequency 9.278 Hz of reactor vertical movement depends on the coolant temperature and there is authorsґ opinion that this reactor vibration is generated by tube – cavity resonance well explained by the Helmholtz resonator theory
- the frequency 18.738 Hz represent the horizontal pendulum motion of the system reactor pressure vessel – core barrel driven by turbulent pressure fluctuations appearing in the near boundary layers of coolant flow
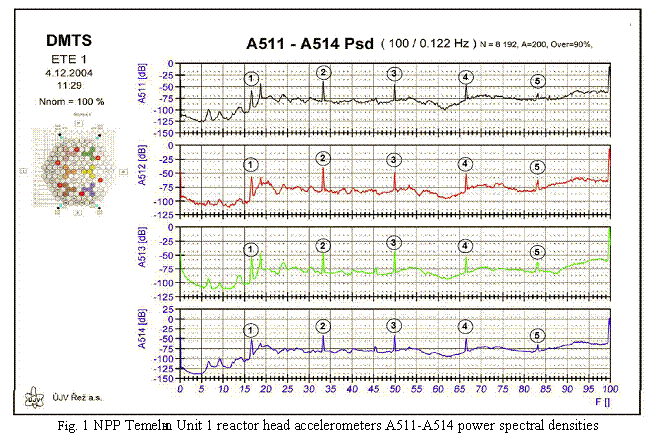
- there are operational frequencies of 16,602, 33,204, 49,926, 66,528, 83,130, c Hz
of forced reactor vibrations induced by corresponding MCP revolution frequencies.
- Power spectral densities of all accelerometers A511-A514 are shown in Fig. 1 with marked MCP revolution frequencies up to 6th harmonic one.
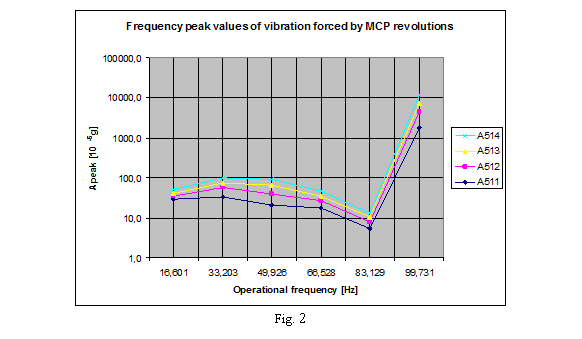
The peak amplitudes of reactor vessel vibration induced by pressure pulsations generated by main circulation pumps MCP revolution are given in Table 2. Their values are well below under acceptable level of 0,1 g in frequency domain [9] but we can mark the 3 order difference
at operational 99.730 Hz which corresponds 6th MCP harmonic. When converting values of Table 2 into Fig. 2 we can see slight curve resemblance of A511 with A512 and A513 with A514 accelerometer couples, which could indicate the similar vibration behaviour of reactor vessel
on these induced frequencies.
|
In the past the revolutions of main circulation pumps rotor were supposed to be constant.
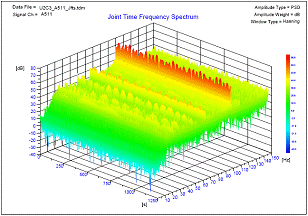
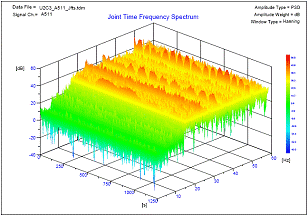
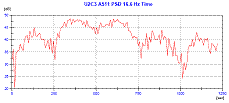
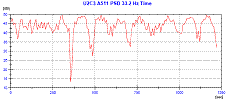
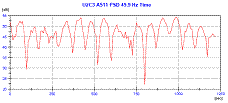
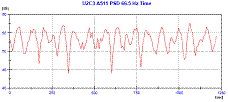
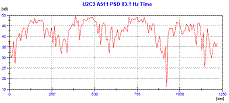
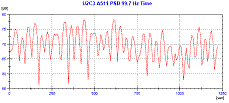
The authors of [6] reported that the power spectral densities of reactor pressure vessel are not stable in time. The operational JTFS spectrograms of A511 head reactor accelerometr presented in Fig. 3 (NPP Temelin Unit No2, 3rd fuel cycle, Nnom=100%) demonstrate clear indication of reactor beat vibration in 0 – 150 Hz frequency range. The different beat forms of particular MCP harmonics
from the same measurement are shown in Fig. 4 for the time interval 0 – 1200 s. Tab 3 gives the amplitude statistics for these beat harmonics where namely frequencies of 49.926, 83.130 and 99.730 Hz are dominating by their average, standard, maximal and range values.
|
|
|
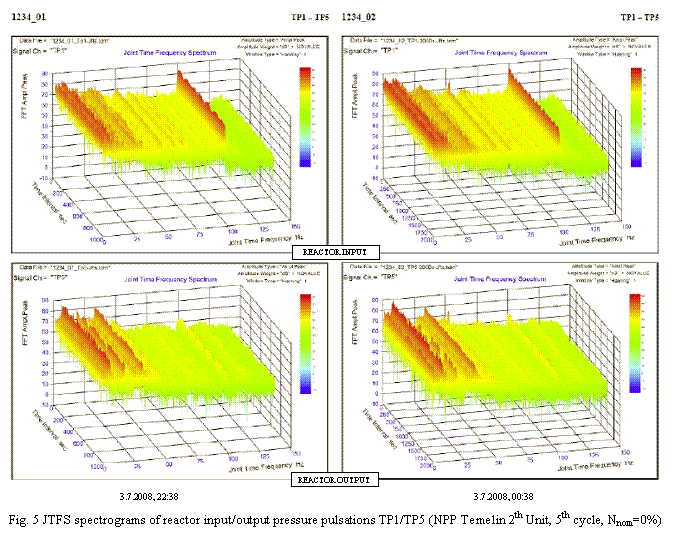
As proved in [7] the similar beat character is observed also for exciting pressure pulsations measured at reactor input and output. The two couples of operational JTFS pressure pulsation spectrograms shown in Fig. 5 (NPP Temelin Unit No2, 5th fuel cycle, Nnom=0%) demonstrate however another feature. The noticeable change of spectrogram couples measured in two hours span is due to changed reactor operation conditions when less loop main circulating pump combinations were examined between the pressure pulsation measurements. It is necessary to mark that these measurements themselves were realized in steady state within time interval 0 – 1000 s.
 |
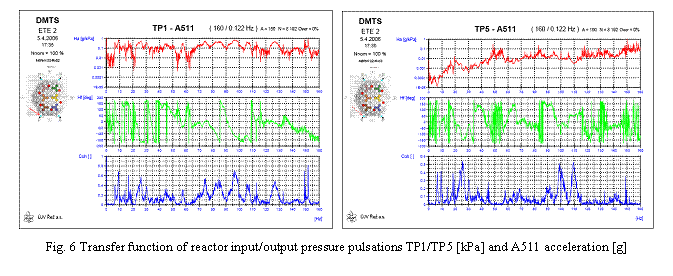
The common beat display of exciting pressure pulsations and reactor vibration at MCP harmonics can be demonstrated when calculating the transfer function between signals of these quantities. In Fig. 6 the close relationship between reactor input/output pressure pulsations TP1/TP5
and reactor vibration A511 is presented when good coherence is achieved also for the MCP harmonics regions.
The developed model of forced reactor vibrations excited by pressure pulsations generated
by main circulation pumps was described in paper [8]. The vibration analysis based on this new generalised reactor model with spatial localization of fuel assemblies, protection tubes and linear stepper control rod drives has confirmed that the slightly different pump revolutions are sources
of the beating effects. These effects cause an vibration amplification and increase a possibility
of the contact loss in internal core barrel linkages.
4.
|
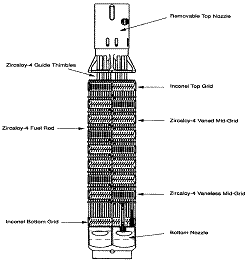
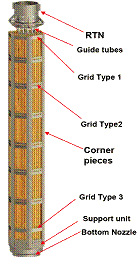
NPP Temelнn units were connected to grid in June 2002 or in April 2003 with initial VV6 fuel load. Then there were successive changes to VV6 Phase 0, VV6 Phase 1X fuel assemblies
from WEC during 4 – 6th fuel cycles of both units. Nowadays they have decided to change fuel supplier to TVEL with TVSA-T fuel assemblies to be loaded in May 2010 in U1C9 cycle. Both fuel assemblies are shown in Fig.7 ([10]). Fuel assembly mechanical, hydraulic and neutron-physical compatibility is expected having been supported by many preparatory works including vibration research ones.
From the operation view of point it is necessary to evaluate continually changes in fuel assemblies dynamic behaviour. The knowledge of fuel assemblies and fuel rods natural frequencies is then an essential step for the utilization of self power neutron detectors SPND signals. These are composed by many source contributions including e. g. collective fuel assemblies vibration but their signal structure is not yet fully identified for the time being. Nevertheless, the qualified information about fuel rods fretting and fuel assembly bowing is required
As described in [11] the natural frequencies of selected reactor components were computed
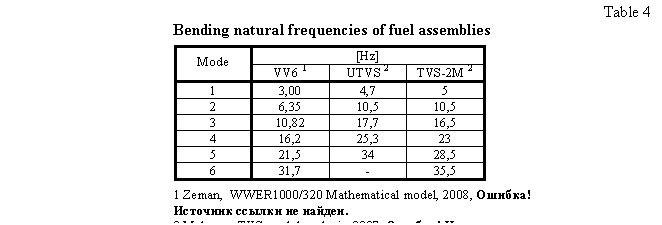
by program “WWER 1000 reactor modal analysis”. This program is the part of mathematical reactor model with 137 degrees of freedom incorporating 8 subsystems of main reactor components (pressure vessel, core barrel, active zone with 163 VV6 fuel assemblies, etc.). The first six bending modes of VV6 fuel assembly natural frequencies are listed in Table 4 together with
the corresponding values for UTVS and TVS-2M assemblies, which were get from the modal experiments with hammer and shaker excitement ([12]).
The analysis of one possible reason of VV6 fuel rod integrity infringement was done for Temelin U2C3 cycle [13]. The starting assumption was the loss of contact between rod and grid in the area
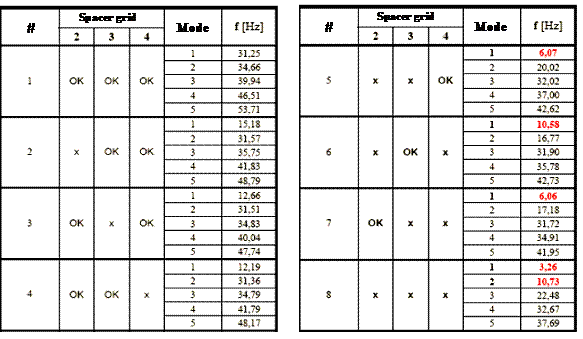
of spacer grids 2, 3, 4 and computed hydrodynamic forces acting on fuel rods were compared with natural bending frequencies of fuel rods. The evaluation of exciting force frequency was done for the velocities of coolant with the characteristic values for a flow around fuel rods (outer diameter of fuel rod as characteristic dimension, Strouhal, Reynolds numbers from velocity models based on Temelin U2C3 operation data). The pulsation of hydrodynamic forces has a frequency in the range 1 – 9 Hz and acts primarily on the level of 1 – 4, 8, 9 spacer grid. Even if the fuel rod natural frequencies estimation was not based on exact VV6 dimension and material data, the overall result (Tab.5)
is considered to be sufficient for the early comparison with the fuel rod exciting forces. It shows relatively big fuel rod infringement probability in the frequency range 1 – 11 Hz.
|
Data from 256 SPND signals are normally acquired by operational diagnostic system RVMS
at 12 bit resolution with 1 kHz sampling frequency and reduced into frequency domain results
with 0,5 Hz resolution. The more detailed measurements by system DMTS (NRI Шeћ, 24 bit resolution in time domain, 0,122Hz in frequency domain) were made at Nnom=100% with all working MCPs during Temelin U1C3 a U2C3 cycles. The acquired data of 15 min unified length were centred, normalized to maximum value and processed in time and frequency domain.
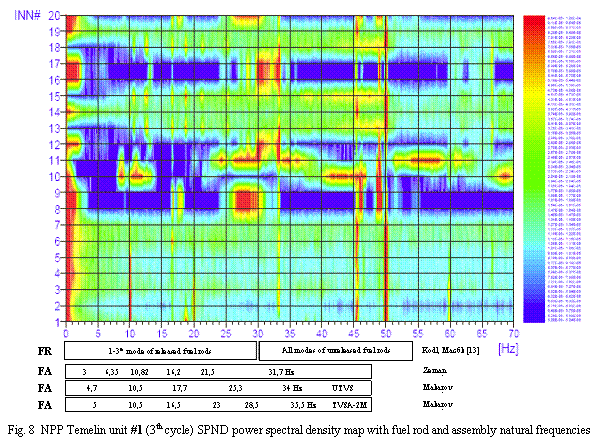
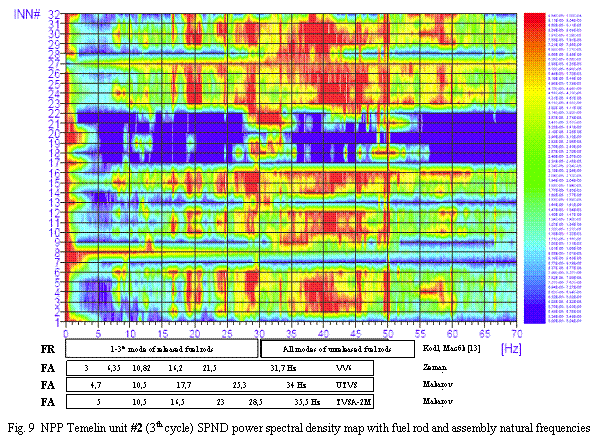
The frequency interval 0 – 70 Hz for processing was determined with regard to above mentioned works [11], [13]. 52 SPND from altogether 272 measured ones were chosen for further evaluation in spectral maps. These maps are constructed as 3D graphs in XY view with arbitrary variables (frequency and spectra serial number) and power spectral density PSD value as a dependent variable. This layout yields overall and quick overview namely in the case when comparison between units is required what was an original aim of the work done in [14]. There are spectral maps for both Temelin units presented in Fig.8 and Fig.9 together with the above mentioned fuel assembly and fuel rod natural frequencies, which are divided in two regions according of released/unreleased, state rod to grid.
When interpreting these spectral maps the following conclusions can be made:
- the peak frequencies and amplitudes occurrence of both units with the same VV6 basic design fuel in the same fuel cycle is distinctively different
- the 2nd unit amplitudes are almost ten times higher with the significant occurrence number also in the region of 1 – 3rd mode released fuel rods natural frequencies
- there are however frequency individual values, smaller or larger regions where the both units behave in similar manner
- the neighbourhood of 9 and 13 Hz
- the revolution frequency 16,6 Hz and its harmonic 33,3 Hz
- the neighbourhood of 18 Hz
- the bands 25 – 30, 30 – 32, 41 – 47 and 49 – 50 Hz.
It is necessary however to be aware of the fact that these conclusions are valid only for the one
of both units cycles.
In order to cover qualified detection of fuel rods infringements, more systematic approach is required in the future.
 |
5. Conclusions
The paper has introduced NPP Temelin diagnostic measurements in conjunction with
the description of reactor vibration. The phenomena of vibration beats namely on main circulation pump revolution harmonics was referred to pressure pulsations generated by main circulation pumps with slightly differed revolutions. The amplitude statistics shows that particularly at 4th – 6th harmonic frequencies the beat character is dominating by average, standard, maximal and range values. These beat phenomena represent inconsiderable component in overall reactor vibration, which can cause contact loss of internal parts during long-term operation.
The operational data from selected self power neutron detectors of both NPP Temelin units were processed together with modal parameters of VV6 and TVSA assemblies to show probable region
of possible fuel rod infringement.
In order to be able to detect fuel incorrect behaviour during the reactor operation it is advisable
to extend synchronous measurement and processing to other diagnostic sensors inclusive main circulating pumps parameters.
References
[1] Tanzer M., Maљek V., Smolнk J., Macбk P. : „The signal measurement evaluation and RVMS system setting-up of NPP Temelin Unit 1“, Љkoda JS plc report No Ae 967/Dok, Plzeт, September 2002, in Czech
[2] Smolнk J.,Tanzer M., Maљek V. : „The signal measurement evaluation and RVMS system setting-up of NPP Temelin Unit 2“, Љkoda JS plc report No Ae/Dok, Plzeт, June 2003
[3] Stulнk P. : “Calibration and On-line Monitoring Methods on Czech NPP Operational Diagnostic Systems”, Technical IAEA meeting on Increasing instrument calibration interval through on-line monitoring technologies, OECD, Halden Reactor Project Halden, Norway, September 2004
[4] Peинnka L., Stulнk P., Љнpek B. : “Operating shapes vibration analysis of NPP Temelin WWER 1000/320 reactor”, Computational Mechanics 2006, 22nd Conference with International Participation, Neиtiny, November 2006, in Czech
[5] Peинnka L., Stulнk P., Zeman V. : “Influence of the operational vibrations on the WWER 1000/320 reactor of NPP Temelin core barrel stability”, 5th International Conference “Safety Assurance of NPP with WWER”., May 2007, Podolsk, in Russian
[6] Peинnka L., Stulнk P. : “Experimental verification of WWER 1000/320 reactor dynamic response to pressure pulsations generated by the main circulating pumps”, Colloquium Dynamics of Machines, Prague, February 2008, in Czech
[7] Stulнk P., Љнpek B. : “The operational dynamic responses of NPP Temelin WWER 1000/320 reactor in less loop main circulating pump combinations ”, Nuclear Research Institute Rez plc, Report No Z 2125, February 2008, in Czech
[8] Zeman V., Hlavби Z. : “Dynamic response of WWER 1000 type reactor excited by the main circulating pump pressure pulsations“, Colloquium Dynamics of Machines, Prague, February 2008, in Czech
[9] Dragunov J. G., Dranchenko B. N, Abramov V. V., Chairetdinov V. U. : ”Vibration studies for WWER designs”,5th International Conference “Safety Assurance of NPP with WWER”.,
May 2007, Podolsk, in Russian
[10] Meинш V. : ”Temelin NPP Fuel experience”, 7th International Conference on WWER Fuel Performance, May 2007, Albena
[11] Zeman V., Hlavби Z., Peинnka L. : “Dynamic response of WWER 1000 type reactor excited by pressure pulsations generated by main circulating pumps“, West Bohemian University report No–, Plzeт, May 2008, in Czech
[12] Makarov V. V., Afanasiev A. V., Matvienko I. V. : ”Modal analysis of the WWER fuel assembly dummies during the force and kinematic vibration excitation”,5th International Conference “Safety Assurance of NPP with WWER”., May 2007, Podolsk, in Russian
[13] Kodl P., Macбk P. : “The possible reason evaluation of fuel assemblies damage”, ЉKODA JS plc report No Jad-Vэp/E26/06, Plzeт, October 2006, in Czech
[14] Stulнk P. : “NPP Temelin in-core detectors analysis in the frequency range important from the fuel behaviour view”, Nuclear Research Institute Rez plc, Report No 13 010, June 2008, in Czech
