

Партнерка на США и Канаду по недвижимости, выплаты в крипто
- 30% recurring commission
- Выплаты в USDT
- Вывод каждую неделю
- Комиссия до 5 лет за каждого referral
2.6. Explanations: UP
- To map the Excel results on the common document page all the items might be copied separately at any free place possible; after that they could be put together.
- To make tables movable select them, next right click – table properties – table bookmark – select “around”; also you may use the “placement” button to adjust the table properties of placements.
- To create the frequency table for Ages you are to create a column for age categories like 0-10, 11-20, ….51-60, more then 60 years. This will look like following:
Ages |
10 |
20 |
30 |
40 |
50 |
60 |
> |
Now you are to specify the statistical Excel function of “Frequency” for one cell right to the first age category of 10 years. There are two data set needed for this function (the ages column of the Excel questionnaire table like C2:C21 and the column of 7 age categories cells like H3:H8 ). This results the only one age category frequency value appears in the cell H3.
F(Age) |
5 |
F(Age) |
5 |
5 |
3 |
3 |
3 |
0 |
1 |
F(Age) | Sum |
5 | |
5 | |
3 | |
3 | |
3 | |
0 | |
1 | 20 |


Next you to clone the result for all the category cells reserved following the steps:
- select all the reserved frequency cells including the first specified :
- press the F2 keyboard functional button;
- press three buttons simultaneously CTRL+SHIFT+ENTER
All the other cells of the reserved column will result the frequency presentation.
Now you are to accomplish this task point – to make a frequency sum cell to ensure the results are correct (the sum must be always equal to the total number of questionnaire records, e. g. 20 ).
- To create the frequency table for Genders you are to …. ????
- To create the frequency table for Positions you are to …. ????
- To create the frequency table for Incomes you are to …. ????
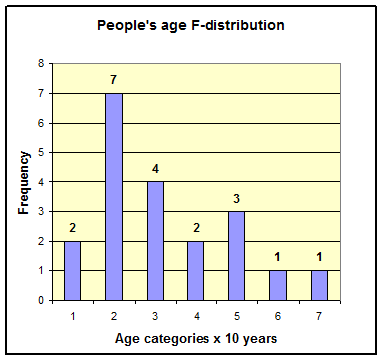
2.7. Diagram of people’s Age Frequency distribution F(Age):
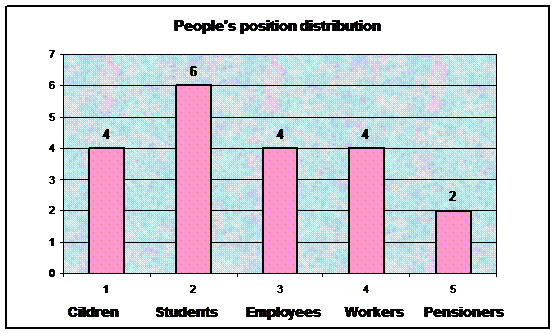
2.8. Diagram of people’s Position Frequency distribution F(Position):
2.9. Explanations:
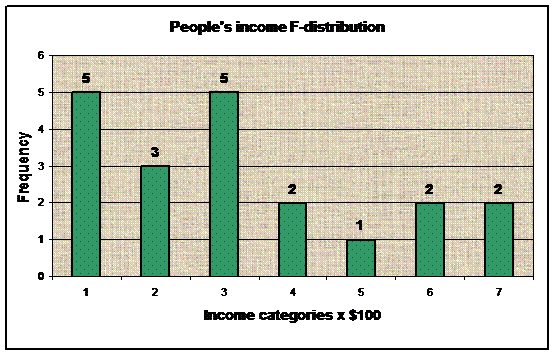
3. Diagram of people’s Income Frequency distribution F(Income):
Be sure all the text and numbers are of good outlook - type Arial bold of font 11-12
4. Obtain descriptive statistics:
- total averages for Age and Income
- Mode and Median for Age and Income
Total averages | |||
Average | Age | = | 27,65 |
| |||
Average | Income ($) | = | 214,00 |
| |||
Mode | of Age | = | 10 |
| |||
Mode | of Income | = | 100 |
| |||
Median | of Age | = | 22,5 |
| |||
Median | of Income | = | 110 |
5. Explanations:
5. Restructuring the initial data table into categories order:
Ages | Gender | Position | Ages | Position | Income | Gender | Income |
10 | female | child | 10 | child | 0 | female | 0 |
25 | f | c | 30 | c | 0 | f | 0 |
30 | f | c | 10 | c | 10 | f | 0 |
45 | f | c | 5 | c | 0 | f | 300 |
40 | f | employee | 35 | employee | 100 | f | 200 |
45 | f | e | 20 | e | 250 | f | 350 |
10 | f | e | 45 | e | 350 | f | 10 |
10 | f | e | 30 | e | 500 | f | 150 |
20 | f | puple | 70 | puple | 100 | f | 100 |
70 | f | student | 20 | student | 100 | f | 100 |
30 | f | s | 25 | s | 0 | f | 500 |
20 | male | s | 10 | s | 150 | male | 100 |
35 | m | s | 10 | s | 100 | m | 100 |
20 | m | s | 18 | s | 120 | m | 250 |
10 | m | s | 20 | s | 100 | m | 100 |
18 | m | worker | 45 | worker | 300 | m | 120 |
5 | m | w | 40 | w | 200 | m | 0 |
40 | m | w | 40 | w | 500 | m | 500 |
20 | m | w | 20 | w | 600 | m | 600 |
50 | m | w | 50 | w | 800 | m | 800 |
5.1 Explanations:

|
Из за большого объема этот материал размещен на нескольких страницах:
1 2 3 4 |
