

Партнерка на США и Канаду по недвижимости, выплаты в крипто
- 30% recurring commission
- Выплаты в USDT
- Вывод каждую неделю
- Комиссия до 5 лет за каждого referral
Source: Kenya, Annual Trade Report, various issues.
Both the volume and the export price of petroleum products also declined in the 1980s and 1990s. The average volume fell from 814 metric tons in to 444 metric tons in and the average price from $0.23 to $0.19 per litre[2].
The relatively poor performance of Kenya's traditional exports suggests that Kenya should focus its export policy on non-traditional exports if it ever hopes to build a dynamic export sector. Table 1 shows that NT exports grew much faster (20.1%) than traditional exports (7.4%) in the 1980s and 1990s. There are four clear episodes: when the share of NT exports was 5.7% of GDP; when it averaged 12.8%; 1989-91 at 5.8% and 1992-96 at 12.4%. According to Landell-Mills and Katz (1991) and UNDP/World Bank (1993), this export performance was mainly driven by domestic policies. The first half of the 1980s experienced a large decline in NT exports due to restrictive trade policies. The quantitative restrictions imposed in 1980 and 1982 resulted in an increase in effective rates of protection that shielded inefficient activities and tended to discriminate against products in which Kenya had a comparative advantage such as food-based manufacturing. The system was also discretionary and non-transparent, making costs, competition in the domestic markets, and access to inputs difficult to predict. The two studies also attribute the high share in to a massive increase in the volume of horticultural exports. The good performance in similarly overlaps with a trade liberalization episode, and has been explained by "removal of bureaucratic bottlenecks and availability of foreign exchange" (Kenya, Economic Survey, 1996).
Enhanced export diversification would reduce the country's vulnerability to external shocks and the commercial risks arising from reliance on a few exports. It can also be expected to reduce export revenue instability and hence promote economic growth (Jebuni et al., 1992). The potential for learning-induced productivity improvements may also increase with the number and variety of export products. According to Mayer (1996), the primary objective of an export diversification policy should be to upgrade a country's production and export pattern by successfully moving up the technological and skill ladder of its products, consistent with the country's human and physical resource endowments, while taking into account dynamic demand potentials in the world markets.
This paper analyses the role of improved market access in enhancing Kenya's non-traditional exports. It specifically investigates the implications for market access of the Uruguay Round of General Agreement on Trade and Tariff (GATT) signed in 1994. This is a most comprehensive series of multilateral trade reforms in several areas, including tariff reforms; agricultural policy reforms; winding up of the Multi-Fibre Agreement (MFA); trade in services; intellectual property rights; and trade related investment measures (Blake et al., 1996). In addition, the World Trade Organization (WTO) was created as a standing body to oversee trade liberalization and maintain the order and due process of the world trading system.
The rest of the paper is organized as follows. Section 2 briefly reviews the major domestic policies, particularly those implemented in the 1990s, that impinge on Kenya's capacity to take advantage of the Uruguay Round and WTO arrangements. Section 3 analyses the likely impact of the Uruguay Round and WTO arrangements on non-traditional exports market access. Section 4 discusses Kenya's capacity for compliance and defense of rights under these arrangements, and Section 5 examines country priorities for future trade negotiations. Section 6 analyses the likely impact of the Uruguay Round and WTO disciplines on foreign direct investment and manufactured exports in Kenya. The paper concludes in Section 7.
2. Domestic policies that impinge on Kenya's capacity to take advantage of market access abroad.
Kenya has implemented numerous trade, export and allied macroeconomic policies in the 1980s and 1990s that impinge on its capacity to produce for export[3].
Tariffs
Economic reforms in the 1980s started with a 10% tariff surcharge that was imposed on all imports and tariff increases on over 200 items. These reforms were continued in 1981 with tariff increases ranging from 2% to 90% imposed on about 1,400 items. There were also tariff reductions on about 20 items used mainly by export-oriented industries.
The tariff reductions started in 1981 were gradually extended in the 1980s and 1990s to more import items, particularly under SAL2 in and in under the World Bank industrial sector adjustment credit. The number of tariff categories, for example, was reduced from 25 to 11, while the maximum tariff rate was reduced from 170% to 70% over . In the budget speeches of , the maximum rate was reduced to 35% and the number of bands to five. The average unweighted tariff rate declined from 41.3% in 1989/90 to 34% in 1992/93 (UNDP/World Bank, 1993).
Tariff reforms implemented in the 1980s and early 1990s had some impact in reducing the effective tariffs. The collected tariff rates increased to a peak in 1982 and then generally declined over the rest of the period (Mwega, 1995).
Quantitative restrictions
Since the BOP crisis of 1971, Kenya has extensively used administrative controls to manage the balance of payments and to provide protection to some industries. Until their abolition in 1993, quantitative import restrictions in Kenya were mainly administered through import licensing. This was pervasive. The number of import products under license increased from 228 in 1972 to 2,737 in 1985, and in the mid 1980s the Import Management Committee was processing an average of 2,000 applications for foreign exchange per week (Dlamini, 1987).
Essential products were put in the less restrictive license categories while the non-essential products were put in the more restrictive import categories or completely banned. Import liberalization essentially involved a shift of items from the more restrictive categories to the less restrictive categories. Until the abolition of import controls in May 1993, the schedules were published annually.
Some progress was made towards relaxation of quantitative restrictions, with an arbitrary mechanism such as the "no objection" certificate eliminated in June 1980, while import items in the less restrictive categories were increased. The share of quota-free imports increased from about a quarter in 1980 to a half in 1987 (Mwega, 1995).
The number of import items under quantitative restrictions further declined to 22.1% in 1990/91, with the average lag between license application and foreign exchange allocation reduced from six months to about three weeks (World Bank, 1990). The coverage of the restricted imports dropped from about 15% in 1990/91 to 0.2% in 1991/92 (UNDP/World Bank, 1993).
Reforms in the direct allocation of foreign exchange were continued in the 1990s. In August 1992, a 100% retention scheme for exporters of 'non-traditional' products was introduced; it was extended (at 50%) to coffee and tea (November 1992) and tourism (February 1993). The policies on retention accounts and the inter-bank foreign exchange market were reversed in March 1993, however, to contain the inflationary spiral following the floating of the shilling. The government accused the retention account holders of hoarding foreign exchange for speculative purposes when the country faced a serious balance of payments problem.
In May 1993, these reforms were re-introduced with the retention accounts at a rate of 50% (increased to 100% in February 1994) for exporters of both goods and services (so long as the proceeds were used or sold within three months, after which they would be sold to the central bank at the official rate; the rate was later unified with the inter-bank rate). Import licenses were abolished except for a short list of items that require prior approval for security, environmental and health considerations. Importers were, however, still required to provide documentary evidence of shipments or of actual importation and the sellers' final invoice before commercial banks could make the appropriate payments (CBK, 1993). In addition, all imports worth over Ksh100,000 f. o.b were still subject to pre-shipment inspection and a clean report of finding issued by a CBK-approved inspection agency.
Direct export promotion policies
By the late 1970s, it was generally agreed that the impact of the manufactured exports subsidy introduced in 1974 was quite limited because the rate was quite low (at 10% of the f. o.b value of goods manufactured in Kenya with a local value-added of at least 30%) and payments were subjected to much delay. In the 1980s, one-third to two-thirds of the total subsidy payments accrued to four firms, while the payments comprised only about 5% of manufactured exports, hence the subsidy had minimal incentive value (World Bank, 1990). In effect, the subsidy was treated as a windfall by those few firms that received it rather than as an incentive for increased exportation.
There were numerous attempts to rectify this situation. For example, the rate was increased to 20% in 1980. Because of BOP problems, however, the scheme was suspended in June 1982. The subsidy was reintroduced in December 1982 at the rate of 10% with a bonus (incremental) rate of 15% to new exporters and those who increased their exports in the previous year. This bonus rate was abolished in 1985 and the basic rate raised to 20%. In 1986 the items eligible for export compensation were reduced from 2,000 to 700, but later increased to 1,260. In 1990, exporters were permitted to process their claims through commercial banks to speed up payments while export firms were given the option to claim import duty/VAT exemptions on imported inputs rather than export compensation.
The manufactured exports subsidy was eventually abolished in September 1993, to be replaced by a duty/VAT remission scheme for intermediate inputs.
Other direct export promotion policies have included the following:
• Attempts to strengthen government departments involved in export promotion and to expedite the handling and processing of the relevant export documents. The development plan argues that export promotion is a government-led activity, which it charges to the Export Promotion Council (EPC) established in 1992. The role of EPC is to organize and participate in trade fairs and exhibitions, to sponsor contact promotion programmes and sales missions, and to carry out market opportunity surveys.
• Support for regional and multilateral trade arrangements including the Treaty for East African Cooperation (in 1993), the Common Market for Eastern and Southern Africa (COMESA), the Lagos Plan of Action, and the WTO.
• Manufacturing-under-bond (since 1989) whereby production is done exclusively for the export market, simplifying the export documentation process and facilitating the importation of inputs.
• Establishing export processing zones (EPZs). EPZs were legislated in 1990 and since then 13 EPZs have been gazetted in Nairobi, Mombasa and Nakuru (Kenya, Development Plan ). Of these 12, are privately promoted while one at Athi River was developed by the government with World Bank support. Since the EPZ legislation, 54 manufacturing projects have been approved but only 20 are operational, which the Plan attributes to a shortage of industrial space for rent. The EPZs have created 3,000 jobs and exports from the zones were valued at $22.3 million in 1994 and $23.4 million in 1995. About 40% of these exports went to the United States, 21% to Africa, 8% to Europe and 7% to the Middle East.
• A pre-shipment export financing facility was also introduced in 1992 but abolished thereafter following massive frauds.
The real exchange rate
The real exchange rate (RER) is one of the most important relative prices in an economy for export performance. An objective of economic reforms in Kenya has been to reduce RER misalignment - defined as sustained deviations of the actual real exchange rate from the "equilibrium" real exchange (Edwards, 1989)[4].
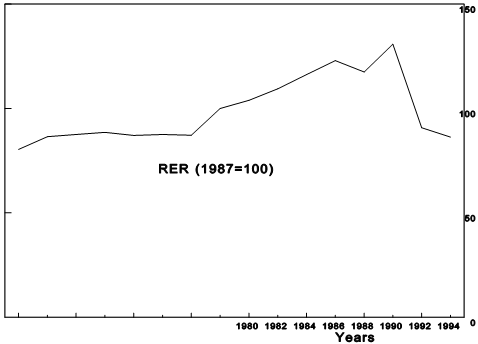
RER is formally defined as the price of tradeables in terms of non-tradeables (Pt/Pnt). Since it is difficult to find an exact empirical counterpart to this definition, various proxies for RER have been estimated in the literature. Usually, RER is approximated by the product of an index of the nominal exchange rate (NER) and an index of wholesale foreign prices (WPI) divided by an index of domestic consumer prices (CPI). Figure 1 shows the evolution of an export-weighted multilateral RER over that is fairly successful in reproducing the salient episodes in the macroeconomic history of Kenya.
Between October 1975 and December 1982, the Kenya shilling was pegged to the SDR, which, calculated from a basket of currencies, was considered to be relatively more stable than a single currency peg especially following the floating of the U. S. dollar in 1973. During the SDR peg, the shilling was subjected to a number of discretionary devaluations. The SDR was abandoned because it was considered inadequate to maintain competitiveness of the Kenya shilling since the weights used did not reflect Kenya's trade pattern, which is more diversified. The currencies included in the SDR accounted for only 40% of the country's combined exports and imports.
A crawling peg exchange rate regime was tried in . The exchange rate was adjusted on a daily basis against a composite basket of currencies of the country's main trading partners to reflect inflation differentials between Kenya and these countries. In this period, the RER generally depreciated and was relatively stable.
In 1991, the authorities adopted a more market-based exchange rate regime. It became government policy to make the shilling convertible by fully liberalizing the current and the capital accounts, with a stable and "realistic" rate to be maintained through prudent fiscal and monetary policies. For example on 30 June 1994 the government officially accepted to abide by obligations of Article VIII of the IMF's Articles of Agreement to promote full convertibility of the Kenya shilling at least for current account transactions (CBK, 1994).
The introduction of the inter-bank market in August 1992 was accompanied by a depreciation of the RER in 1993. The RER subsequently appreciated in .
In a study of the fundamental determinants of a bilateral RER over , Mwega and Ndung'u (1996) found that terms of trade, government expenditure and real economic growth have significant negative impacts (at least at the 10% level). Government expenditure was mainly spent on non-tradeables while technological progress (proxied by real economic growth) mainly favoured the tradeables. They also found that the degree of openness and net capital inflows had insignificant coefficients, reflecting the fact that Kenya has not undertaken deep reforms. While the RER generally depreciated in the study period, the trade ratio shows that the Kenya economy became less open over time. The reduction in openness reflects poor export performance leading to import capital inflows as a proportion of GDP have also substantially declined since the 1980s[5].
RER misalignment is formally defined by Edwards (1989) as deviations of the real exchange rate from its long-run equilibrium level (ERER). Since ERER is not observable, RERM is proxied in various ways. One method, suggested by Ghura and Grennes (1993), is to estimate the time path of ERER from a cointegration equation and normalize it so that it starts from a common base with the actual RER during a period when the economy was to a large extent in internal and external balance.
Taking 1970 as a year in which Kenya had both internal and external balances (Elbadawi and Soto, 1995), the results showed that the country registered average misalignment of 6.8% in the 1980s and 8.9% in the first half of the 1990s. The Mwega and Ndung'u (1996) results support the contention that Kenya has on average maintained a fairly good foreign exchange rate policy (Takahasi, 1997).
Other domestic policies important for export performance
Finance
The ability of exporters to respond to exchange rate and trade liberalization policies will also depend on availability of finance, which respondents in field surveys often identify as a most important constraint to exporting. In Kenya's Regional Programme of Enterprise Development (RPED) survey, for example, a large proportion of firms (80%) mentioned lack of or cost of financing their operations and expansion as a moderate to major obstacle. Lack of credit, for example, was ranked ahead of lack of demand, infrastructure and business support services as major constraints to firm expansion. An analysis of this survey concludes that collateral borrowing did not work well, so that access to credit is restricted for nearly all groups of firms, particularly very small ones (Departments of Economics, 1994).
Producing for export requires access to finance for working capital and pre-shipment activities, as well as to capitalize production to enhance export capabilities. Export credit insurance is also important since it helps exporters gain confidence in tapping new markets. Kenya does not provide either export credit or insurance guarantee facility.
Kenya has a fairly well developed financial system[6]. In the 1960s and 1970s, the government followed a policy of maintaining low fixed interest rates to promote investment. In the 1980s this policy was changed and the rates were frequently adjusted upwards in an effort to keep them positive in real terms. They were fully liberalized in July 1991 to allow them to vary with the demand and availability of loanable funds. A major concern through the 1990s is the high level of interest rates, which have been pegged on the treasury bill rate, which has remained high as the authorities have implemented a tight monetary policy. This also reflects the oligopolistic nature of the banking system, which is dominated by four banks that control four-fifths of total deposits. These banks focus on short-term lending to finance commerce, mainly foreign trade. As argued by the development plan, "the short-term nature of their own corporate interests are (sic) in conflict with national interests which require longer-term commitments and a better appreciation of the needs of the Kenya economy. Their policies of concentrating on a small corporate clientele have implied indifference or even hostility to small savers and borrowers..." The state has significant interests in two of the major banks.
Besides these institutions, Kenya has five state-owned development finance companies (DFIs) that provide medium - and long-term finance to industry, commerce and agriculture[7]. A major limitation of DFIs is that they lack effective statutory powers to raise funds independently and have been financially dependent on the state. As the government budget has become squeezed, financing of DFIs has lost out. They have also mainly financed parastatals, hence had limited impact on export performance.
While Kenya has a well developed money and financial system, its capital market is still in its infancy, with only 30% of the shares quoted on the Nairobi Stock Exchange. The market for short-term securities continues to be dominated by government paper. Business firms in Kenya rarely raise capital through public issues of equity and debt securities. The main sources of local equity for new investment continue to be retained earnings, savings of family groups, direct government investment and the development banks. Parastatals and private firms rely to a large extent for debt finance on direct borrowing, largely through bank overdrafts.
Price and wage policies
Another set of export incentives relates to (until recently) price controls and the cost of labour. Price controls started to be extensively applied following the BOP crisis of 1971. Price decontrols started in 1987 when ten products were removed from the price control order. In 1988, another 20 products were price-decontrolled and the process continued so that only 13 commodities were subjected to controls by 1991. These were eventually abolished in December 1993.
During the existence of controls, affected producers complained about long delays between application and the grant of a price increase while the cost-plus method applied to determine prices did not fully incorporate differences and changes in the input structures. The method also did not encourage firms to reduce their costs of production and to be efficient, which is necessary if a firm is to venture into foreign markets. It was therefore argued that price controls impeded entrepreneurship, investment, exports and growth, the combined effect of which was likely to outweigh the positive impact on price stability.
Since 1973, the government has used wage guidelines and the Industrial Court to regulate wages. Partly as a consequence of this policy, real wages declined drastically in the 1980s and 1990s. Private sector real wages declined at an average rate of 1.2% per year in the 1980s and by 4.4% per annum in , perhaps increasing the competitiveness of domestic producers. Those of the public sector declined by 1.9% per year in the 1980s and by 7.7% per year in (Manda, 1997).
Infrastructure
Another constraint to producing for exports is infrastructural inadequacies, including transportation, water, electric power, waste disposal, security and telephones as well as secure, reasonably priced storage and warehousing facilities at ports. In the Kenyan RPED survey, only 31% of the firms felt unaffected by infrastructural problems. In the face of poor delivery of these services, many firms take recourse to self-provision of some of these infrastructural services such as electricity, water and security arrangements, thereby reducing their competitiveness.
The effects of the new WTO discipline on these policies
The main objective of the Uruguay Round is to reduce tariff and non-tariff barriers in order to enhance world trade. Many African countries have undertaken substantial unilateral trade liberalization in the 1980s and early 1990s reflecting a shift in paradigm from import-substitution to export-promotion development strategy, the collapse of communism and the adoption of market-based reforms. Unilateral trade liberalization is quite consistent with the spirit and philosophy of the Uruguay Round, even though these reforms, were implemented as part of the IMF/World Bank reform programmes. It is expected that the liberalized trade regimes under the Uruguay Round will improve Kenya's export performance by increasing market access particularly into developed countries.
Under the Uruguay Round, all countries are required to tarifficate quantitative restrictions, to bind their tariffs against further increases and to reduce them over time (developing countries by 24% over ten years). The agreements also require that all duties and charges applying to a bound tariff be included in the schedule of commitments with the bound rate of duty on various products. This is to ensure that a bound tariff concession is not nullified by the imposition of other duties or charges. Members of the WTO can challenge the existence of these other duties and charges in a country.
Within agriculture, for example, NTBs must be translated into tariffs and the combined bound tariffs are subject to an average reduction of 24% (for developing countries) by 2004 or a minimum cut of 10% for each tariff line over a period of ten years. For the least developed countries (those with per capita income of less than $1,000), these tariff reductions are not required, although they can bind their tariffs (Donovan and Osei, 1996). Countries are required to provide information on the products subject to tariffication and current and minimum access conditions, where minimum access is defined as 3% of domestic consumption in the base years, this rising to 5% by 2004. When current access is already above the required minimum level, no further import provision is required.
The new discipline requires a reduction of the total "aggregate measure of support" (AMS) to producers especially in the agricultural sector. Developing countries must reduce AMS by 13.3% from the level, with equal annual steps. Least developed countries are again exempt. Many forms of assistance that have minimal effects on trade are also exempt from this commitment including direct payments to producers. In addition, a de minimis clause allows product support that does not exceed 10% of the value of production of a basic product or non-product support that is less that 10% of a developing country's value of agricultural production.
The Uruguay Round agreements have provisions to cope with dumping. They permit countervailing measures when subsidized imported goods are hurting domestic industries and include an agreement on safeguards when a surge of imports (even if not dumped or subsidized) is sufficient to cause or threaten to cause serious injury to domestic industries that produce similar or competitive products. Two tests must be satisfied before anti-dumping duties are imposed. First is clear determination of injury or threat of injury to a domestic industry. Second is an investigation to establish that the goods in question are being imported at a price less than the "normal" price in the country of origin so as to establish a margin of dumping, which becomes the additional duty imposed on specific imports expressed as an ad valorem or specific duty. All anti-dumping actions terminate after five years, unless a full review determines that revoking the action would cause continued injury.
Prior to the coming into force of WTO, Kenya undertook various policy actions that would now be suspect. The country applied variable duties on some products that were charged where the landed cost of a commodity fell below a gazetted domestic reference price. Starting from Fiscal Year 1995/96, the variable duty was replaced by a combination of specific and ad valorem rates. The specific rates are compared with the duty chargeable under advalorem rates, and the higher rate is applied. This has applied to maize, sugar, rice, milk and milk products, and wheat[8]. Provisions also exist that permit these duty surcharges to be increased up to 70% of the legislated rates. It is not clear whether Kenya fulfilled WTO rules before imposing these anti-dumping duties.
Among the direct export promotion policies, the Uruguay Round agreements prohibit the use of export subsidies (and subsidies that aim at encouraging use of domestic products over imports). These must be reduced from the base level in by 24% in value (for developing countries) over an eight-year period, during which the subsidies cannot be increased. Subsidies to reduce costs relating to export marketing and internal transportation costs are exempt, however. Developing countries and least developed countries (with per capita income of less than $1,000) are exempt from the export subsidy reductions, although no new ones may be introduced. These subsidies, however, can be countervailed by importing countries if they cause serious injury to their domestic industries, hence the need to maintain trade and exchange rate policies that remove the need for subsidies.
The WTO rules also prohibit export restrictions except in a few specified situations: (a) to implement standards and regulations; and (b) to prevent or relieve critical shortages of foodstuff or other essential products. The rules however permit an export product to be relieved of indirect taxes in the exporting country, but not direct taxes such as income or profit taxes on producers. The rules also permit countries to levy duties on exports if these are necessary to control exports or to achieve some other policy objectives.

|
Из за большого объема этот материал размещен на нескольких страницах:
1 2 3 4 5 6 7 |
