

Партнерка на США и Канаду по недвижимости, выплаты в крипто
- 30% recurring commission
- Выплаты в USDT
- Вывод каждую неделю
- Комиссия до 5 лет за каждого referral
New Nuclear Generation
Resource, Cost, and Performance Assumptions
Current Status of Technology
Nuclear generation from plants owned by or under long-term contract to California utilities currently provides 11% of the electricity used to serve California loads, with an additional 2% of generation from nuclear plants depending on the method used to assign generation to imports.[1] Within the WECC as a whole, nuclear generation constitutes about 8% of the total electricity supply.[2] All nuclear generation originates from large plants that run year-round providing baseload power, using heat from the fission of enriched uranium fuel to operate steam turbines.
Nuclear generation does not produce significant GHG emissions. Lifecycle GHG emissions from upstream and downstream processes such as construction, mining, fuel preparation, embedded energy in cooling water, and spent fuel storage and processing are not included in the California emissions inventory, and so the emissions intensity of nuclear generation is zero.[3] A 1985 California law prohibits the construction of new nuclear generating plants in California until such time as the state determines that the nuclear waste storage problem is solved. The two in-state nuclear generating stations, PG&E’s Diablo Canyon and SCE’s San Onofre, are permitted to continue to operate until retired; currently, however, they do face new environmental requirements associated with cooling water use (see Plant Retirements and Repowering Report). New nuclear plants have been discussed elsewhere in the WECC, but currently no new nuclear plant license applications for locations in the WECC have been received by the federal Nuclear Regulatory Commission.
Reference Case Resource, Cost, and Performance Assumptions
Table A gives the reference case resource, cost, and performance assumptions for new nuclear generation used in the GHG calculator. The reference technology to which these assumptions apply is a new 1350 MW light water reactor (LWR) using enriched uranium fuel.[4] These costs do not apply to so-called “fourth generation” nuclear technologies such as high-temperature gas reactors (HTGR) or to breeder reactors, which are not included as options in the GHG calculator. Nuclear fusion reactors are also not included.
The values in Table A are largely derived from the EIA’s Annual Energy Outlook 2007, which is considered a relatively unbiased source for new technology cost and performance estimates. However, AEO 2007 costs are generally too low, as they do not reflect recent capital cost increases resulting from higher materials costs and unfavorable exchange rates. The Table A reference case values are adjusted to reflect these increases.
The nuclear fuel resource is assumed to be unlimited. The base capital cost for new nuclear plants is $3333/kW, prior to applying zonal cost multipliers (see Table B) and prior to adjusting for financing costs during construction (see “Financing and Incentives” report). This value is based on the AEO 2007 total overnight cost assumption, adjusted for inflation and recent increases in the cost of materials. Reference case non-fuel variable O&M costs are $0.51/MWh and fixed O&M costs are $68.79/kW-year. The reference case performance values are a heat rate of 10,400 Btu/kWh and a capacity factor of 85%, which follow the AEO 2007 assumptions.
Table A. Nuclear Cost, Resources, & Performance
| 2008 value | 2020 reference case value | 2020 tech growth case | Range of 2008 values in model | Sources |
Base generation capital cost ($/kW) | $3,3331 | $3,333 | $3,333 | $3,066 - $3,9992 | Reference case: [EIA, 2007] Tech growth case: [Assumed no net change] |
AFUDC Multiplier (%) | 150% | 150% | 150% | 150% | [CEC 2007 Beta Model, adjusted for 6 year lead time compared to 4 for coal] |
Variable O&M ($/MWh) | $0.513 | $0.51 | $0.51 | $0.51 | [EIA, 2007] |
Fixed O&M ($/kW-yr) | $68.793 | $68.79 | $68.79 | $63.29 - $82.552 | [EIA, 2007] |
Gross resource in WECC (MW) | No limit applicable. | No limit applicable. | No limit applicable. | No limit applicable. | [n/a] |
Filtered resource in CA (MW) | No limit applicable. | No limit applicable. | No limit applicable. | No limit applicable. | [n/a] |
Filtered resource in Rest-of-WECC (MW) | No limit applicable. | No limit applicable. | No limit applicable. | No limit applicable. | [n/a] |
Nominal Heat Rate (BTU/kWh) | 10,400 | 10,400 | 10,400 | 10,400 | [EIA, 2007] |
Capacity factor (%) | 85% | 85% | 85% | 85% | [EIA, 2007] |
Notes:
1Base value originally reported in 2005$ in EIA AEO 2007. Cost has been adjusted (a) from 2005$ to 2007$ at rate of 25% per year to account for recent price escalation, and (b) from 2007$ to 2008$ at general inflation rate of 2.5%.
2Capital costs and Fixed O&M costs in model vary by region, based on state-specific factors from US Army Corps of Engineers, Civil Works Construction Cost Index System (CWCCIS), March 2007. Lowest multiplier for region in WECC is WY (0.92); highest multiplier is CA (1.20)
3Fixed and Variable O&M cost originally reported by EIA in 2005$. Costs have been adjusted from 2005$ to 2008$ at general inflation rate of 2.5%.
Zonal Levelized Costs
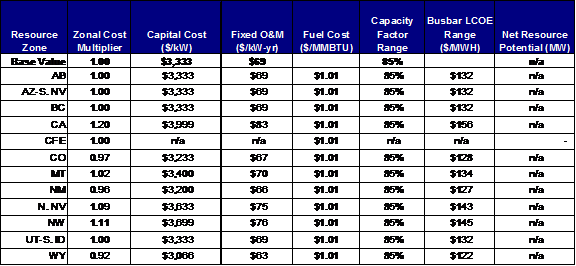
Table B shows reference case busbar levelized costs for new nuclear generation in each of the 12 WECC zones used in the GHG calculator. They are derived by applying zonal cost multipliers from the U. S. Army Corps of Engineers to the base generation and O&M costs in Table A, along with financing costs during construction, and are calculated based on merchant financing assumptions.. Table B also shows the reference case fuel cost assumption of $1.01 per million Btu, with no zonal variation (see Fuel Cost Assumptions Report). The reference case range of levelized cost of energy (LCOE) for nuclear power in the WECC is $122-156/MWh. Other costs associated with new nuclear generation in addition to busbar costs, for example the costs of transmission interconnection and long-distance transmission, are covered in separate reports
Table B. Nuclear Busbar Levelized Cost by Zone
Notes:
1All values shown in 2008$.
2Capital Cost and Fixed O&M Cost by zone are calculated by multiplying base value for cost by the zonal cost multiplier.
3Fuel costs are for 2020, and shown in 2008$. Data from 2005 SSG-WI database, and have been inflated (a) from 2005$ to 2008$ at general inflation rate of 2.5%, and (b) from 2005 to 2020 at an annual fuel price escalation rate of 3% real. For resource zones containing multiple SSG-WI regions, fuel costs are have been averaged.
4Busbar levelized Cost of Energy (LCOE) is calculated using cost and performance data from this table, as well as: (a) financing during construction cost multiplier and non-fuel variable O&M costs from preceding table, (b) insurance of 0.5% of capital cost, (c) property tax of 1% of capital cost, and (d) income tax liability.
Sources
California Air Resources Board, Draft California Greenhouse Emissions Inventory, August 2007. http://www. arb. ca. gov/cc/ccei/emsinv/emsinv. htm
California Energy Commission, “2006 Net System Power Report,” CEC07, CEC Staff Report, April 2007.
California Energy Commission, Beta Model for “Comparative Costs of California Central Station Electricity Generation Technologies,” June 2007.
California Energy Commission, “Comparative Costs of California Central Station Electricity Generation Technologies,” CEC11-SD, CEC Staff Report, June 2007.
http://www. energy. ca. gov/2007publications/CEC11/CEC11-SD. PDF.
Keystone Center, “Nuclear Power Fact Finding,” June 2007
MIT, “The Future of Nuclear Power: An Interdisciplinary MIT Study,” 2003. http://web. mit. edu/nuclearpower/
Northwest Power Conservation Council, “The Fifth Northwest Electric Power and Conservation Plan,” July 2005.
http://www. nwcouncil. org/energy/powerplan/plan/Default. htm.
U. S. Energy Information Administration, “2007 Annual Energy Outlook, Electricity Market Module Assumptions,” DOE/EIA-0554, April 2007. http://www. eia. doe. gov/oiaf/aeo/assumption/pdf/electricity. pdf.
[1] The CEC 2006 Net System Power Report shows 31,959 GWh of specified coal generation, and 6,191 GWh of coal in unspecified imports, out of a total gross system power of 294,865 GWh in 2006.
[2] CEC 2007 IEPR Scenarios, 2009 Scorecard.
[3] CARB 2007.
[4] EIA AEO Assumptions 2007, Table 39.
