

Партнерка на США и Канаду по недвижимости, выплаты в крипто
- 30% recurring commission
- Выплаты в USDT
- Вывод каждую неделю
- Комиссия до 5 лет за каждого referral
Laboratory work #12
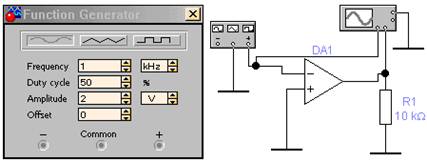
Fig.12.1
Construct the circuit according to Fig.12.1. Switch on the circuit.
Depict the oscillograms of input and output voltages.
Define the input voltage threshold value  .
.
The oscillograms of input and output voltages
____________( the input voltage threshold value)
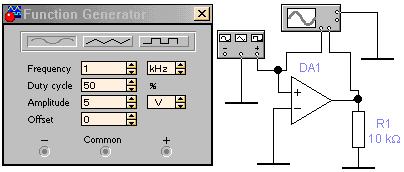
Fig.12.2
Construct the circuit according to Fig.12.2. Switch on the circuit.
Depict the oscillograms of input and output voltages.
Define the threshold value of the input voltage .
The oscillograms of input and output voltages
____________
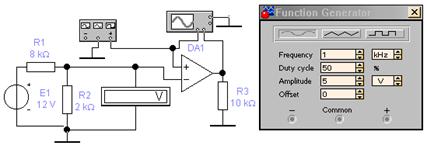
Fig.12.3
Construct the circuit according to Fig.12.3. Switch on the circuit.
Depict the oscillograms of input and output voltages.
Define the threshold value of the input voltage .
The oscillograms of input and output voltages
____________
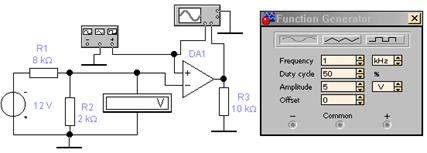
Fig.12.4
Construct the circuit according to Fig.12.4. Switch on the circuit.
Depict the oscillograms of input and output voltages.
Define the threshold value of the input voltage .
The oscillograms of input and output voltages
____________
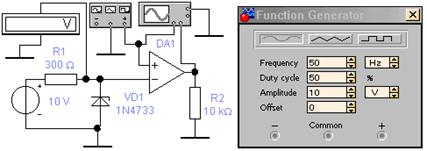
Fig.12.5
Construct the circuit according to Fig.12.5. Switch on the circuit.
Depict the oscillograms of input and output voltages.
Define the threshold value of the input voltage and compare it with the zener voltage value.
The oscillograms of input and output voltages
____________
a) Construct the circuit according to Fig.12.6. Switch on the circuit.
Depict the oscillograms of input and output voltages.
Using the obtained oscillograms define the levels of the output and threshold voltages.
The oscillograms of input and output voltages.
The level of the output voltage  _______,V.
The threshold voltage level____________,V.
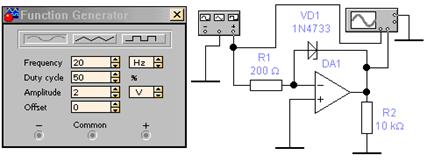
Fig.12.6
b) Change the zener diode’ position.
Depict the oscillograms of input and output voltages.
Using the obtained oscillograms define the levels of the output and threshold voltages.
The oscillograms of input and output voltages.
The levels of the output voltage _______,V.
The threshold voltage level____________,V.
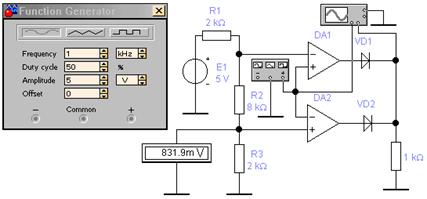
Fig.12.7
a) Construct the circuit according to Fig.12.7. Switch on the circuit.
Depict the oscillograms of input and output voltages.
Using the obtained oscillograms define the upper and lower threshold voltage levels.
The oscillograms of input and output voltages.
The upper threshold voltage level  _______,V.
The lower threshold voltage level  ____________,V.
Your report must contain the circuits and characteristics of operational amplifiers.
Question list
Practical considerations
Offset voltage
Bias current
Drift
Operational amplifier models
Widely used operational amplifiers
Application of operational amplifiers
Analog-to-Digital Conversion
Successive Approximation ADC
Flash ADC
Digital-to-Analog Conversion
Difference Amplifier
Summing Amplifier
Comparison to Standard Voltage
Noise Effects on Comparator
