

Партнерка на США и Канаду по недвижимости, выплаты в крипто
- 30% recurring commission
- Выплаты в USDT
- Вывод каждую неделю
- Комиссия до 5 лет за каждого referral
Ismo Koponen, Mr.
M. Sc. (Econ. - Intl. Marketing). Freelance Researcher -
Doctoral Candidate
Mäntyseläntie 8, FIN-93600 Kuusamo
GSM: +358-(0)-500-929066. E-Mail: ismo. *****@***fi
The Role of National Innovativeness in
Selecting an International Trading Partner
A Russian Case
Report presented to the ISPIM 2003 Conference in
Manchester, United Kingdom, June 9 - 11
Abstract. The general purpose of my research project is to quantify a human factor of several determinants that presumably affect international cultural distances either narrowing or widening gaps between business organizations. The more specific aim of this paper is to report on my study on innovativeness as a possible additional factor in the context of international partner selection. An assumption studied is that business people’s attitude is more positive towards the most innovative, alternative, foreign business culture. A survey (n=78) has been made in Russia - the source business culture - to seek support for my ideas. The two target business cultures were Sweden and Finland.
Key words: cultural distances, innovativeness, international business and partner selection.
Acknowledgements: I wish to thank the Foundation for Economic Education (Liikesivistysrahasto) and the Marcus Wallenberg Foundation. They both support my project ‘Measuring Cultural Distances - Creating and Testing a Dynamic Method’.
Introduction: This cross-cultural case study that I base on some empirical data from Russia is a specific project itself. The very meaning of the study is to contribute to cultural distances model development and to extract innovativeness from other cultural factors.
The report is divided into three chapters. 1) In the first one, I will briefly introduce the present paradigm of cultural differences and describe the three focal cultures with help of Geert Hofstede’s four cultural dimensions. In addition to this I will introduce my own AIKA factor concentrating, however, on only one of its four determinants, namely ‘attitude’. This, definitely, calls for some attitude theory. I will try to answer the call. 2) In the second chapter I will introduce the empirical data and explain my methodological choices. 3) Chapter three is reserved for the data analyses. Here, I will describe three different groups of innovative Russian business people trying to predict their behavior as partners on international markets.
1. Cross-Cultural Research in Present Theories
Since I am going to use Hofstede’s four dimensions for describing the cultures of Sweden, Finland, and Russia it is necessary to familiarize ourselves with some of his ideas. Here are a few statements. About doing cross-cultural research, in general. “...in studying ‘culture’ we compare societies (Hofstede, 15). “...studying differences in culture among human groups and categories that think, feel, and act differently does presuppose a position of cultural relativism” (ibid. 21). “Cultural relativism does not imply normlessness for oneself or for one’s own society. It does call for one to suspend judgement when dealing with groups or societies different from one’s own” (ibid.).
How distant are the societies or cultures in question, is a general level question that my research on the AIKA factor deals with. From the determinants of the a. m. factor only one has been considered relevant for this very study, namely ‘A for Attitude’. The other determinants of the factor are Interest, Knowledge, and Adaptation ability. It is a coincident that the word ‘aika’ in my native Finnish language has the meaning of ‘time’. Time is, indeed, an important dimension of any dynamic phenomenon; thus, also, of the cultural distances between international business organizations. (...attitudes toward a behavior are found to correlate well with the corresponding behavior, and since they can be assessed ahead of time they can be used to predict behavioral performance” (Aizen, 1988: 109).
But, back to Hofstede: “Language is both the vehicle of most of cross-cultural research and part of its object. The problems with the use of language in research about culture start before the actual translation of questions. The researchers and their informants may behold different normative expectations about the use of language” (2001: 21). The developers of the semantic differential (a research instrument described later) evaluate the ‘psycholinguistic’ instrument: “...we do not find any appreciable difference between factors in terms of reliability. Cultural meanings of concepts prove to be very stable - for any factor, a shift of only about four-tenths of a scale unit is significant for at the 95 per cent level. This degree holds despite the small sizes of the groups, only about 25 in each” (Osgood et al, 1957: 139-140). Their scale had 7 units. Later, Osgood with other co-authors, ask: “Can we avoid the problem of subjective judgment based on translation?” (1975: 31). Their answer is: “Subjects are not the same, ... and scales are obviously not the same, ... but culture-common concepts are at least closely translation-equivalent” (ibid). I will proceed with a certain feeling of confidence.
Hofstede’s own research covers all the three cultures of the mini triad in focus. Data (Index Score Estimates) on Russia were added in 1996 (see e. g. 2001: 502).
Table 1. Culture Index Scores of Hofstede’s Dimensions
[Comment1] Dimension Culture | Power Distance | Uncertainty Avoidance | Individualism (vs. Collectivism) | Masculinity (vs. Femininity) |
Austria | 11 | 90 | ||
Denmark | 23 | |||
Finland | 33 | 59 | 63 | 26 |
Greece | 112 | |||
Portugal | 27 | |||
Russia | 93 | 95 | 39 | 36 |
Slovakia | 104 | 110 | ||
Sweden | 31 | 29 | 71 | 5 |
In the above table there are all the scores for the cultures of the mini triad and the European extremes, dimension by dimension. I have limited the results to European cultures, only, because it is now easier for the readers to ‘see’ the scores on a geographical map, I hope.
Sweden hits one record with her low masculinity index, other record scores going to cultures outside the triad. Row sums of the scores for the triad cultures are: Sweden 136, Finland 181, and Russia pared with Sweden and Finland Russia seems to have the highest power distance index, the highest uncertainty avoidance index, and she seems to score lowest on individualism (i. e. highest on collectivism), and has the highest masculinity index, too. Please, pay attention to the fact that Russia does not score between the two other cultures, not for a single dimension. The score difference between Sweden and Finland is 45 points. It is 82 points between Finland and Russia, and 127 between Russia and Sweden.
This can give an idea about cultural distances between the triad’s nations. One should, however, be careful with the possible assumption that all the cultural dimensions are on the same vector.
2. Developing and Exploiting the Research Instrument
As stated in the beginning, I have chosen ‘attitude’ from my AIKA factor. Before going to the attitude measurements it is necessary to review a few ideas concerning attitudes and their measurements. Ajzen argues e. g., that “An attitude is a disposition to respond favorably or unfavorably to an object, person, institution, or event”, and that:
“Like personality trait, attitude is hypothetical construct that, being inaccessible to direct observation, must be inferred from measurable responses. Given the nature of the construct, these responses must reflect positive or negative evaluations of the attitude object. Beyond this requirement, however, there is virtually no limitation on the kinds of responses that can be considered” (1988: 4).
An attitude is obviously based on a person’s beliefs, or as Fishbein and Ajzen put it: “...a persons’ attitude toward some object is determined by his beliefs that the object has certain attributes and by his evaluations of those attributes” (1975: 14). “The concept ‘attitude’ should be employed only where there is clear evidence that the obtained measure places the concept on a bipolar affective dimension” (ibid, 56).
Instrument development. Because I find national innovativeness an important issue I have added a set of questions on innovativeness to my original questionnaire that basically was designed for collecting data on the AIKA factor, only. The questions (in set 5 of the form) are:
Innovativeness. How innovative / creative do you find people around you? Are
a) the Swedish, innovative or not innovative,
b) the Finnish, innovative or not innovative,
c) Russians, innovative or not innovative,
d) people in your organization, innovative or not innovative,
e) foreign people with whom you co-operate, innovative or not innovative,
f) do you find yourself innovative or not innovative, and
g) do you find yourself in an innovative or not innovative job position?
The idea behind my choice of the a. m. questions is that the respondents are individuals that work in the very centre of their own world. They should be able to state whether they are or are not innovative individuals in an innovative or not innovative surrounding. They should also be able to evaluate several zones of their surrounding environment. The questions on the foreign cultures in focus - Sweden and Finland - are limited to only one plus one, concerning the nations’ general innovativeness.
As a measuring scale for every question I have used a so-called visual analogue scale (VAS) consisting of 21 ‘pixels’. With a verbal expression in both ends of the scales they have formed a variation of the semantic differential scale e. g. like this:
innovative (---------------------) not innovative
The positive poles were always at the left end of each scale and the negative ones at the right end of them. This is typical for the semantic differential scales, and I have been ‘obedient’. On my opinion the other way round could be a more logical or a more mathematical way of doing this. Nevertheless, the 21 pixels of the scales make it possible to consider every scale a true bipolar scale with a zero in the centre,
+2, +1, 0, -1, -2.
Since it is important to determine the exact position of zero I have reserved one (whole) pixel for it. If we judge the technique mathematically, this is wrong because the zero, actually, has no dimensions at all; the zero cannot be measured. This is, of course, a problem with any bipolar scale that reserve a space for the zero - usually as wide as for any true digit.
The VAS has made it possible for me to exploit the scale as a four point unipolar one, ranging between four and one ( 4, 3, 2, 1). This was important for me because I wanted to avoid ‘messing’ with the zero, this time. One benefit of this VAS is that I may, later, rescale the instrument - without any violation to data - returning to the intented bipolar scale. Unipolar or bipolar, both the above numeric expressions rest on a semantically bipolar dimension. As stated before, bipolar scales are a necessity e. Fishbein and Ajzen. They argue that “Our definition of attitude requires a measurement procedure whereby a person assigns some concept to a position on a bipolar evaluative dimension” (1975: 56). A few markings on the very centre of my VASes confused me first but then I decided to read these markings two-point-five.
Mr Peter Soukhov, Ph. D., (board director of OMIS, St Petersburg, Russia) supplied me with the data, in May 2002. I am very grateful for Dr Soukhov’s expert assistance in translating the form into the Russian language and in redesigning it for the Russian audience. The total amount of filled in questionnaires is 128. For the calculations and analyses I have used 78 of them (form numbers from 51 to 128). The SPSS (version 11.5) software was of great help, too. The calculations and analyses are communicated in the following chapter.
About the sample. The 78 answerers of the survey represent firstly - and mainly - the clientele of OMIS, i. e. Russian business people that have lived true the process of belief, attitude, intention, and behavior concerning education in international business at the particular institution, and secondly - more generally - Russian business people from St Petersburg.
Table 2. The Sample Quantified by Gender and Generation, (n=78)
Demographics | 1. Gender: Male (46%) | 2. Gender: Female (54%) |
1. Generation: X, Juniors (32%) - age: up to 30 years | 11 | 14 |
2. Generation: Seniors (68%) - age: 31 years or over | 25 | 28 |
The juniors represent the so-called Generation X that are highly computerized and communicate wirelessly. They are also the first generation of Russians who have done most - or all - of their education and career in the Post-Soviet Russia. The youngest respondent was 19 years of age. The seniors, on the other hand, have studied and perhaps also done a part of their career under the Soviet regime. The oldest respondent was 54 years of age.
Table 3. Russians’ Attitudes Towards the Target Cultures, (n=78)
Importance of Attitudes | 3.35 |
Attitude Towards The Swedish | 3.50 |
Attitude Towards The Finnish | 3.46 |
Last year, I obtained the score 3.66 (max: 4) for the general importance of attitudes (see Koponen, 2002: 7).
3. Extracting Innovativeness from the Russian Data
There is only a marginal difference between the Russians’ beliefs concerning the innovativeness of Swedes and Finns. The appropriate scores are: 2.73 for the Swedish, and 2.43 for the Finnish. Data reduction from eleven determinants resulted in loadings on the following three components:
Table 4. Innovative Russians Categorized, (n=78)
Components Determinants | Westerners | Innovative Individualists | Innovative Collectivists |
INNovativeness of SWEdes INNovativeness of FINns ATTitude towards FINns INN of foreign COMpanions ATTitude towards SWEdes INNovativeness of own JOB INNovativeness of oneself INNovativeness of RUSsians INN of Russian ORGanizations | ,821 ,821 ,680 ,667 ,527 | ,865 ,846 | ,864 ,723 |
SPSS Information: Extraction Method: Principal Component Analysis. Rotation Method: Quartimax with Kaiser Normalization. Rotation converged in 4 iterations. Kaiser-Meyer-Olkin Measure of Sampling Adequacy: ,munalities: between,404 and,817. Reliability Coefficients 11 items (incl. Gender and Generation):
Alpha = ,7525. Standardized item alpha = ,7423.
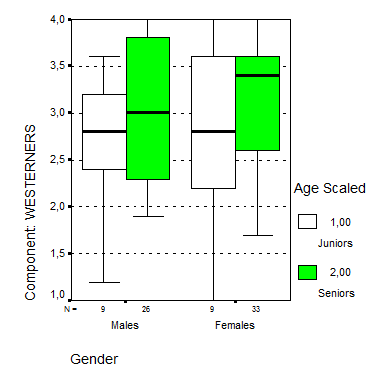
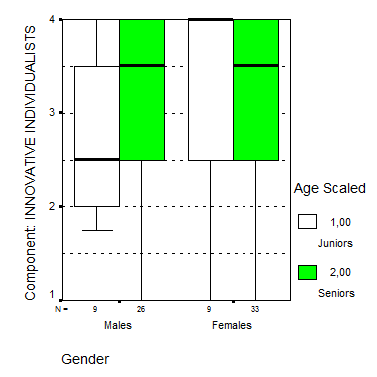
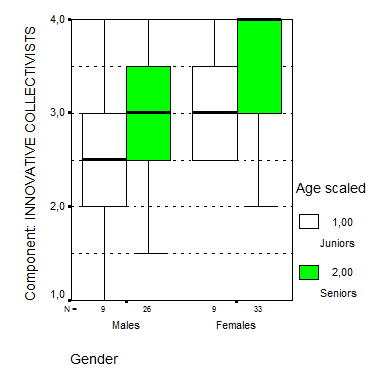
Who are the people behind the components? Further analysis of the data claims that: 1) people from the older age group load heavily on The Westerners component, and they are more likely to be females than males; 2) The Innovative Individuals component is extremely heavily loaded by the younger females, while 3) the older females seem to dominate The Innovative Collectivists component (see appendix I, please). The ‘westerners’ have a very strong belief that Swedes and Finns are more innovative than Russians. They also have a very positive attitude towards the foreign cultures in focus.
All in all, it seems to me that there is a small general correlation between the two phenomena, namely innovativeness and attitude. People that score very high on the general innovativeness factor also have a - more than average - positive attitude towards Swedes and Finns (see appendix II, please).
Coming back to attitude theory, I have to refer 1) firstly to Ajzen and Fishbein: “...attitude, no matter how assessed, is only one of the many factors that influence behavior”, and “To predict a single behavior we have to assess the person’s attitude toward the behavior and not his attitude toward the target at which the beahvior is directed” (1980: 26 and 27). OK, I shall bear this in mind as a limiter of my own studies. The a. m. authors also state that:
“A deeper understanding of the factors influencing behavior, however, requires that we look for the determinants of the attitudinal and normative components. We shall see that this search will lead to a consideration of the beliefs individuals hold about themselves and their environment, that is, to the information they have about themselves and the world in which they live” (1980: 64);
and 2) secondly, I have to refer to Aizen alone. In 1988 he argued that: “..., people are likely to perform a specific behavior if they view its performance favorably, and they are unlikely to perform it they view its performance unfavorably” (109).
As concluding remarks on the above analyses, I can 1) argue that there is a correlation between belief of national innovativeness and self attributed attitude towards a foreign culture, and 2) presume that innovative individuals might also prefer innovative international business partners.
References:
Ajzen, Icek (1988). Attitudes, Personality, and Behavior. Milton Keynes: Open University Press.
Ajzen, Icek and Martin Fishbein (1980). Understanding Attitudes and Predicting Social Behavior. Englewood Cliffs: Prentice-Hall, Inc.
Hofstede, Geert (2001). Culture’s Consequences - Comparing Values, Behaviors, Institutions, and Organizations Across Nations. Thousand Oaks: Sage Publications.
Koponen, Ismo (2002). Are Organizational Cultural Distances Affected by Another Human Factor - Innovativeness? Part One: Developing the Dynamic Method. Report presented to the ISPIM 2002 Workshop in Rome, Italy, September 15-17.
Fishbein, Martin and Icek Ajzen (1975). Belief, Attitude, Intention and Behavior: An Introduction to Theory and Research. Reading: Addison-Wesley Publishing Company.
Osgood, Charles E, George J Suci and Percy H Tannenbaum (1957). The Measurement of Meaning. Urbana: University of Illinois Press.
Osgood, Charles E, William H May and Murray S Miron (1975). Cross-Cultural Universals of Affective Meaning. Urbana: University of Illinois Press.
Appendix I: Components (loadings on determinants)
1) The Westerners (attitudes on Swedes and Finns)
2) Innovative Individuals (innovativeness of own job and oneself)
3) Innovative Collectivists (innovativeness of own nation and organizations)
Appendix II
Table 5. Russians’ Innovativeness / Attitudes Towards The Swedish and The Finnish
Russians' Innovativeness | Statistics | Attitude Towards Swedes | Attitude Towards Finns |
Low | Mean | 3,2700 | 3,1400 |
| N | 31 | 31 | |
| Std. Deviation | 1,07888 | 1,19159 | |
High | Mean | 3,6500 | 3,6600 |
| N | 47 | 47 | |
| Std. Deviation | ,57023 | ,69240 | |
Total | Mean | 3,5000 | 3,4600 |
| N | 78 | 78 | |
| Std. Deviation | ,82572 | ,95069 |
A complete data matrix with SPSS outputs can be claimed from the author.
ismo. *****@***fi
[Comment1]