Партнерка на США и Канаду по недвижимости, выплаты в крипто
- 30% recurring commission
- Выплаты в USDT
- Вывод каждую неделю
- Комиссия до 5 лет за каждого referral
IME 312 Spring 2007
Hypothesis Testing Examples
By: Dr. Parisay
This handout assists in discussion on how to interpret hypothesis testing examples, as well as, effect of different parameters in final conclusion. Detailed solutions will be discussed in class. Dr. Parisay’s comments are in red
Version 1: The average height of females in the freshman class of a certain college has been 162.5 centimeters. (that is  ) Is there a reason to believe that there has been a change (that is not equal) in the average height if a random sample of 25 females (that is n=25) in the present freshman class has an average height of 165.2 centimeters (that is
  ) and a variance of 49 Cm2 (that is
  )? Assume that the confidence level is 0.99.


(Notice that you do not have the population variance. Therefore, you should use ‘t’ test statistics. This version will result in accepting the null hypothesis. Then, reject the alternate hypothesis. That is, there has been no change in the average height with 99% CL.)
Version 2: The average height of females in the freshman class of a certain college has been 162.5 centimeters. Is there reason to believe that the average height has decreased if a random sample of 25 females in the present freshman class has an average height of 165.2 centimeters and a variance of 49 Cm2? Assume that the confidence level is 0.99.


(This version will result in accepting the null hypothesis. Therefore, we reject the alternate hypothesis. That is, the average height has decreased with 99% CL)
Version 3: The average height of females in the freshman class of a certain college has been 162.5 centimeters. Is there a reason to believe that there has been a change in the average height if a random sample of 25 females in the present freshman class has an average height of 165.2 centimeters and a variance of 49 Cm2? Assume that the confidence level is 0.9.
(This version will result in rejecting the null hypothesis. Then, accept the alternate hypothesis. That is, there has been a change in the average height with 90% CL.)
Version 4: The average height of females in the freshman class of a certain college has been 162.5 centimeters. Is there a reason to believe that there has been a change in the average height if a random sample of 61 females in the present freshman class has an average height of 165.2 centimeters and a variance of 49 Cm2? Assume that the confidence level is 0.99.
(This version will result in rejecting the null hypothesis. Then, accept the alternate hypothesis. That is, there has been a change in the average height with 99% CL.)
Version 5: The average height of females in the freshman class of a certain college has been 162.5 centimeters. Is there a reason to believe that there has been a change in the average height if a random sample of 25 females in the present freshman class has an average height of 165.2 centimeters and a variance of 16 Cm2? Assume that the confidence level is 0.99.
(This version will result in rejecting the null hypothesis. Then, accept the alternate hypothesis. That is, there has been a change in the average height with 99% CL.)
Questions:
Compare Version 1 and Version 2. What is the difference in problem information/statement and conclusion?
Compare Version 1 and Version 3. What is the difference in problem information and conclusion?
Compare Version 1 and Version 4. What is the difference in problem information and conclusion?
Compare Version 1 and Version 5. What is the difference in problem information and conclusion?
Version 6: The average height of females in the freshman class of a certain college has been 162.5 centimeters with a standard deviation of 6.9 centimeters (that is  ) . Is there reason to believe that there has been a change in the average height if a random sample of 61 females in the present freshman class has an average height of 165.2 centimeters? Assume that the confidence level is 0.99.
(We have population’s variance, as well as, Central Limit Theorem will hold as n>30, variance is known, it is two sided hypothesis testing for mean, and should use ‘Z’ test statistics. It will result in rejecting null hypothesis.)
Version 7: The average height of females in the freshman class of a certain college has been 162.5 centimeters with a standard deviation of 6.9 centimeters. Is there reason to believe that the average height is increased if a random sample of 61 females in the present freshman class has an average height of 165.2 centimeters? Assume that the confidence level is 0.99.


(We perform ‘Z’ test. This version will result in NOT rejecting the null hypothesis. Therefore, we reject the alternate hypothesis.)
Questions:
Compare Version 1 and Version 6. What is the difference in problem information and conclusion?
Compare Version 6 and Version 7. What is the difference in problem information and conclusion?
Version 8: The standard deviation of height of females in the freshman class of a certain college has been 6.9 centimeters (that is  ). Is there reason to believe that there has been a change in the variance of height if a random sample of 30 females in the present freshman class has a variance of 49 Cm2. Assume that the significance level is 0.02.


(Notice, here is a case that you do not care about the value of the mean. You just would like to test on variance. You will use Chi-square test statistics. This version will result in NOT rejecting the null hypothesis. Therefore, reject the alternate hypothesis. Conclusion is that population variance has not changed based on the above sample, with CL=0.98.)
Version 9: The average height of females in the freshman class of a certain college has been 162.5 centimeters. Is there a reason to believe that there has been a change in the average height if a random sample of 25 females in the present freshman class has an average height of 165.2 centimeters and a variance of 49 Cm2? Use a P-value for your conclusion
(That is, find P-value and discuss any significance level less than that will result in not rejecting the null hypothesis. Another approach is to check if P-value is small, let’s say less than 1%, then reject null hypothesis. The reason is that usually significance level will be more than 5%. However, if P-value is large, let’s say more than 10%, do not reject the null hypothesis.).
Questions:
Compare Version 1 and Version 9. What is the difference in problem information and conclusion?
Version 10: The average height of females in the freshman class of College AB has been 163 centimeters (that is  ) with a standard deviation of 6.9 centimeters (that is
  ). A random sample of 50 females (that is n1=50) in the present freshman class has an average height of 165.2 centimeters (that is
  ). The average height of females in the freshman class of College CD has been 162.5 centimeters (that is
  ) with a standard deviation of 7 centimeters(that is
  ). A random sample of 36 females (that is n2=36) in the present freshman class has an average height of 163.5 centimeters (that is
  ). Assume that the significance level is 0.02. Is there reason to believe that there has been a change in the difference between the average height of these two colleges?


(This version will result in NOT rejecting the null hypothesis. Therefore, reject the alternate hypothesis. That is the difference between average height remains as much as 0.5 centimeters. Notice that you will use Z test statistics.)
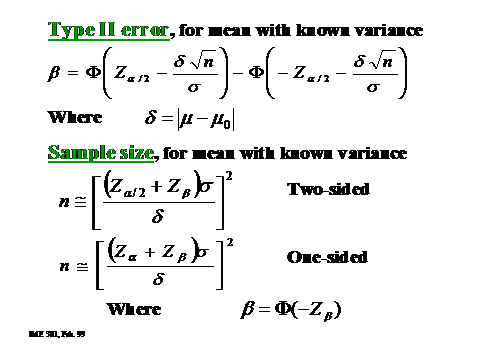
Version 11 (skip now): The average height of females in the freshman class of a certain college has been 162.5 centimeters with a standard deviation of 6.9 centimeters. Is there reason to believe that there has been a change in the average height if a random sample of 36 females in the present freshman class has an average height of 165.2 centimeters? Assume that the confidence level is 0.99. What will be the type II error if the mean of population is in fact 163 centimeters?
(We have population’s variance, as well as, Central Limit Theorem will hold as n>30. It is two sided hypothesis testing for mean. We should use ‘Z’ test statistics. It will result in accepting null hypothesis.)