
Партнерка на США и Канаду по недвижимости, выплаты в крипто
- 30% recurring commission
- Выплаты в USDT
- Вывод каждую неделю
- Комиссия до 5 лет за каждого referral
Financial Ratios
Financial ratios are used to analyse data shown on financial statements. This is so managers have information to make correct business decisions as a means of monitoring the financial success of a business.
The data is represented as ratios and percentages, so comparisons between data can be measured.
The financial ratios used include:
- Liquidity Solvency Profitability Efficiency
Liquidity
Measured using the current ratio
Liquidity refers to the ability of a business to meet is financial commitments in the short term (12 months) when they fall due. This ratio can be applied using a balance sheet.
For example: $180000 / $110000 = 1.63:1
- In this example, the business has $1.63 in current assets to $1 in current liabilities. This is seen as a reasonable level of liquidity.
Typically, a ratio of 2:1 is seen reasonable, but this depends on the industry of the business. Some business, like Dentists, do not need a high ratio like 2:1 and instead usually has a ratio of 1:1 or even lower.
Business that sell finished goods and keep large inventories, like Woolworths, have larger ratios of 2:1
Gearing (Solvency)
Measured using the debt to equity ratio
This refers to the proportion of the mixture of debt and equity in a business. Gearing ratios determine a businesses solvency, the ability of the business to meet long term financial commitments.
Measures the extent to which a business relies on borrowed funds. The higher the ratio, the greater the reliance on borrowed funds. A business that relies heavily on borrowed funds is said to be highly geared.
For example: $610000 / $870000 = 0.7:1
- In this example, the business has 70c on liabilities to $1 of equity. Meaning they are able to pay off long term debts
A debt to equity ratio of less than 100% is reasonable, but some industries like manufacturing companies have a higher debt to equity ratio as potential for profits out weighs the risks.
Having a high debt to equity ratio can be risky for a business. It may turn away investors and potential stakeholders, HOWEVER the greater the risk the greater potential for profit.
Excessive gearing levels can lead to the business not being able to pay the debts back, leading to business failure. But if gearing is too low the management may lose profitable investment opportunities, could also indicate a failure to effectively utilise or handle debt.
A business must have an appropriate mixture of debt to equity.
Profitability
Measured through 3 ratios.
Gross Profit ratio Net Profit ratio
 |  |
 |
Return on Equity Ratio
Profitability refers to the ability of a business to make a financial return on the business. Measured through an income statement. These ratios are a good indication of the financial well-being of the business and a measure of how well it is being managed.
Poor earnings can have a negative effect on the companies share price, ability to pay dividends and attract potential stake holders.
Gross Profit Ratio
Gross profit is the difference between sales revenue and the costs of good sold. The gross profit ratio represents the profit made on the sale of goods without deducting expenses.
For example: $420000 /$ 700000 x 100 = 60%
- Each dollar of sales here is producing 60c in gross profit. This can be good or bad, but it really depends on the business and is hard to identify between industries. But 60c gross profit is pretty great.
Net Profit Ratio
Measures the level of profit after expenses are deducted from the gross profit made. Gives a more accurate reading of profit for a business.
For example: $200000 / $700000 x 100 = 28.5%
- This means the business made 28.5c profit from the sales made.
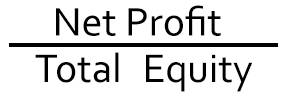
Return on Equity Ratio
Shows how effective funds contributed by the owners have been in generating profit, and hence a return on their investment. Measures the net profit gained as a return on owners invested funds.
For example: $200000 / $870000 x 100 = 23%
- For every $1 the owner invested, they get 23c back as a return on their investment, pretty reasonable investment.
Efficiency
Measured through 2 ratios.
 |  |
Expense Ratio Accounts receivable turnover ratio
This refers to the ability of a business to use its resources in ensuring financial stability & profitability of the business.
Relates to the effectiveness of management in maintaining the goals and objectives of the business. More effective, the greater the profits and financial stability.
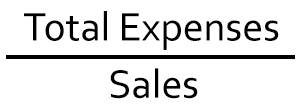
Expense Ratio
Relates sales figures to the total expenses of the business. Relates also to the day to day operations of the business.
For example: $220000 / $700000 x 100 = 31.5%
- For every $1 of sales, 31.5 c makes up expenses.
Expenses can be further divided into selling, financial and general expenses on a profit and loss statement.
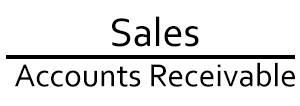
Accounts Receivable turnover Ratio
Looks at how effectively a business is at managing its credit and collecting debts. How efficient the credit policy of the business is.
For example: $700000 / $70000 = 10 or 36.5 days, by dividing 10 into 365 days of the year.
· This means they collect their debts every 36.5 days. This can be good or bad, depending on the companies credit policy. If it is 30 days, its not so good, but if its 90 days its good.
Comparative Ratio Analysis
These ratios are used mainly for comparison reasons to give meaning to raw figures. There are 3 ways a business can use these ratios.
- To consider trends overtime To make comparisons against industry standards (average) to make comparisons with similar businesses.
A business manage must determine through comparisons if a trend is a good one or a bad one
For example: A decline in the gross profit ratio over 2 years can be bad, managers must look at causes of this decline and determine what solutions can be found.
When comparing to other businesses and industry standard, the business managers must consider the appropriate ratio for their business. They can also check if their ratios are in line with the averages of their industry.
For example: Woolworths net profit ratio may be much lower than say, a corner store, because of their large turnover of sales allow them to operate with a smaller margin per item.
