

Партнерка на США и Канаду по недвижимости, выплаты в крипто
- 30% recurring commission
- Выплаты в USDT
- Вывод каждую неделю
- Комиссия до 5 лет за каждого referral
RESEARCH COMMUNICATIONS
Title Page
Title: Soil Erosion in Punjab
Names of Authors: Sharmistha Pal1*, G. S. Sidhu2, A. K. Tiwari1, Dipak Sarkar3 and V. N. Sharda 4
1 ICAR-Indian Institute of Soil and Water Conservation, Research Centre, Chandigarh - 160 019
2Former Principal Scientist and Head, National Bureau of Soil Survey and Land Use Planning, Regional Cenre, IARI Campus, New Delhi - 110 012
3 Former Principal Scientist and Director, National Bureau of Soil Survey and Land Use Planning, Amravati Road, nagpur, Maharashtra - 440 033
4Krishi Anusandhan Bhavan-I, Pusa, New Delhi - 110 012
* Corresponding author
Dr. Sharmistha Pal, Scientist (Soil Science)
ICAR-Indian Institute of Soil and Water Conservation, Research Centre, Sector 27-A,
Madhya Marg, Chandigarh -160 019
Telephone: +91 172- 2659365
TeleFax: +91 172- 2650783
E-mail: sharmistha. *****@***com
Keywords: Conservation planning, Punjab, Soil loss, Universal Soil Loss equation
Soil Erosion in Punjab
Sharmistha Pal1, G. S. Sidhu2, A. K. Tiwari1, Dipak Sarkar3 and V. N. Sharda 4
1 ICAR-Indian Institute of Soil and Water Conservation, Research Centre, Chandigarh - 160 019
2 Former Principal Scientist and Head, National Bureau of Soil Survey and Land Use Planning, Regional Centre, IARI Campus, New Delhi - 110 012
3 Former Principal Scientist and Director, National Bureau of Soil Survey and Land Use Planning, Amravati Road, nagpur, Maharashtra - 440 033
4Krishi Anusandhan Bhavan-I, Pusa, New Delhi - 110 012
Abstract
Soil Erosion Map of Punjab highlights the degree of soil erosion caused by water in the state. The values of soil loss per annum from each grid location were quantified using Universal Soil Loss equation (USLE) and used in GIS for preparing the soil erosion map of Punjab state. About 87% of the total geographical area of Punjab state has annual soil loss below 5 Mg ha-1 and doesn’t require specific soil conservation measures. About 4.02% area is affected by annual soil loss of > 15 Mg ha-1 which includes moderately severe (0.88%), severe (1.72%) and very severe (1.42%) soil loss @ 15 to 20, 20 to 40 and 40 to 80 Mg ha-1, respectively. This necessitates the development of improved technologies (conservation agricultural practices, contour bunding, contour cultivation etc.), which need to be adopted for improving the productivity on sustainable basis.
Introduction
Assessment of severity of soil erosion and its prioritization for designing soil and water conservation measures is a challenging task due to lack of reliable data base. Globally, out of the total land area of 13.5 billion ha, about 2 billion ha (15 %) is affected by water erosion1. This may lead to a loss of 1.4–2.8 % of the total agricultural, pasture and forestland by 20202. The different kinds of land degradation in India has affected around 120.72 million ha area, the highest (68.4 %) being contributed by water erosion (82.57 mha) 3.
The decline in production by washing out surface soil through water erosion negatively affects food security4. The water erosion removes of 13.4 million tonnes soil per year, which amounts to economic loss of $2.51 billion5.
Singh et al6, reported water erosion rate of less than 5 Mg ha-1 yr-1 to over 80 Mg ha-1 yr-1 in Shivalik. Velayutham and Bhattacharya7 reported 5-50% loss of productivity due to moderate erosion of 10-20 Mg ha-1yr-1. The state level soil loss maps have been prepared using USLE for Gujrat8, Maharastra9 and Kerala10 . Yadav and Sachdev11 reported that 77.07, 17.28, 2.87, 1.09, 1.09 and 0.43 per cent area in Haryana experiencing soil loss in the range of < 5, 5-10, 10-15, 15-20, 20-40 and >40 Mg ha-1 yr-1, respectively. In Himachal Pradesh, Yadav and Sidhu 12 reported erosion rates from 0.08 to 683.10 Mg ha-1 yr-1.
In the Shivalik of Punjab, each centimetre loss of surface soil has been reported to decrease maize yield by 103 kg ha-1 13. Keeping in view the urgency of mapping soil erosion in Punjab based on real time data base as generated through Soil Map of India Project for other states, the present study has been attempted.
Materials and Methods
Punjab state lies between 29o 30’and 32o 32’ N latitudes and 73o 55’ and 76o 55’ E longitude, with an area of 5.03 m ha and covers 1.5 per cent of the total geographical area of India. The soils of Punjab falls into 4 orders viz., Inceptisols, Entisols, Aridisols and Alfisols. The mean annual rainfall ranges from 300 mm Abohar to 1200 mm (Pathankot), with an average of 705 mm. The soil erosion in Punjab is mostly caused by rain water.
Computation of different factors of USLE
The USLE14 is an empirical model that estimates mean soil loss from a field. This equation predicts losses from sheet and rill erosion only. The rills are small intermittent watercourses, usually only a few inches deep. The gully is deep ditch cut by running water. Soil loss (A) in Mg per hectare per year is computed by following equation:
 (1)
(1)
Rainfall Erosivity Factor (R)
The factor ‘R’ is the annual total value of the erosion index (EI30) for a specific site. Rainfall erosivity (R) is expressed in Mega Joules-millimetre (MJ-mm) per hectare-hour-year (ha-hr-yr). It is computed as the product of storm energy times the maximum 30-minute intensity and added for all storms in a year. The KE of storm in metric unit is calculated by equation developed by Wischmeier and Mannering15.
Ram Babu et al.16 collected the rainfall data of 50 years from automatic rainfall recorder for 45 stations in India and computed EI30 value for each storm. Linear relationships were established between mean annual erosion index (YA) and mean annual rainfall (XA) and seasonal erosion index (YS) and average seasonal rainfall (XS) (equations 2 and 3).
 (2)
(2)
 (3)
(3)
From these values and additional data from 225 stations, iso-erodent map of India showing R-values of different parts of country including Punjab was prepared. These stations are located at district, tehsils and some selected blocks of the state. These values were used as a source for confirming R-value of different grids. Additionally, 30 years data of monthly rainfall for 20 stations of the state were collected and annual and seasonal R-values were computed using the regression equations of Ram Babu et al.16. Spatial estimation of rainfall erosivity is computed from the climate data of a given station and then converting point data in to polygon data through krigging techniques of GIS.
Soil Erodibility Factor (K)
The K factor is a measure of erodibility of a particular soil under the standard condition of unit USLE plot, under continuous fallow. It is measured in Mg-ha-hr/ha-MJ-mm. It was calculated from soil erodibility monograph14, by putting the values of texture, organic matter, structure and permeability of soil. It can also be calculated by the equation 4. The values were taken from the 586 grids soil data collected by NBSS&LUP during soil resource mapping of the state and analysed in the laboratory.
 (4)
(4)
Where,
M is particle size parameter (per cent silt + per cent very fine sand) (100- per cent clay)
a is per cent organic matter
b is soil structure code (very fine granular, 1; fine granular, 2; medium or coarse granular, 3; blocky, platy, or massive, 4)
c is profile permeability class (rapid, 1; moderate to rapid, 2; moderate, 3; slow to moderate, 4; slow, 5; very slow, 6)
Topographic Factor (LS)
The L factor is the ratio of soil loss from the field slope length to that from standard plot (22.13 m) length under similar conditions and slope steepness (S) factor is the ratio of soil loss from the area with specified cover and management to that from a 9 per cent slope under similar bined values of LS factor for different lengths and degrees of slope have been compiled17 and these were used to obtain LS value for different grids.
Cover and Management Factor (C)
The C factor is the ratio of soil loss from an area with particular cover and management condition to a similar area in continuous fallow. The preliminary data for estimating cover and management factor for various crops grown at a particular grid has been taken from the profile data sheet18 district wise statistics of Punjab state19 and compilation of Singh et al. 20.
Conservation Practice Factor (P)
The P factor is the ratio of soil loss with a particular support practice to the corresponding loss with up and down cultivation. The C factor was identified based on the cropping intensity in different districts. Maximum C factor of value ‘1’ is taken from clean cultivated field i. e. without any crop cover and the value decrease with increase of cropping intensity. The values of these factors have been worked out by different workers and compiled by Singh et al.20 and Wischmeier and Smith14. The main conservation practices followed at the grid point, were taken from the survey data of NBSS&LUP, Nagpur during resource mapping of Punjab state19 and compilation of Singh et al. 20.
Results and Discussion
Soil Loss Estimation due to Erosion
The grid information (10 x 10 km) at different georeferenced locations in Punjab was collected from the soil resource data of Punjab for computation of K, LS, C, and P factors. Maps were generated by using GIS through putting point data in polygon of representative station by krigging interpolation and creating polygons. The latitude, longitude and soil values for different grid points were used in GIS for generating soil erosion map of Punjab.
Six erosion classes were generated depending on the values of soil loss in the state. The R, K, LS, C and P factors were classified into different classes and presented in map. The data in Table 1 reveals that the largest area (87.51%) in the state has very slight to nil erosion. Some parts of Dhar and Patahnkot areas constituting about 7.16% of total geographic area (TGA) of the state are affected by moderate erosion as a result of runoff of water on sloppy lands having slopes ranging from 8 to >15% (Figure 1).
Foothills of Shiwaliks, constituting 1.72% area is affected by severe erosion due to seasonal streams locally called as ‘Choes’ during rains and it causes havoc in low lying areas (piedmonts) in districts of Jalandhar, Hoshiarpur, Rupnagar, Nawanshahar, Pathankot and Hoshiarpur. The side slopes in Shiwaliks hills (1.42%) are subjected to very severe erosion due to rapid runoff losses. In Punjab state only 3.14 % area is suffering from severe to very severe soil erosion, which is mainly in Shiwaliks and its foot hills in northern parts of the state. This area is also popularly known as the Kandi area.
The maps related to different factors of USLE are presented in Figures 2-6. The erosivity factor (MJ-mm/ha-hr-yr) data indicates maximum R value (>400 MJ-mm/ha-hr-yr) was observed in northern parts which are dominantly sub mountainous areas of Shiwaliks, followed by 300-400 MJ-mm/ha-hr-yr. in foot hills of Shiwaliks, 300-400 MJ-mm/ha-hr-yr in central parts (alluvial plains) and <200 MJ-mm/ha-hr-yr in southern parts (sandy areas) of the state. Four classes of C-values were identified in the state, having the maximum area between 0.25 to 0.50 categories. It indicates the maximum crop coverage in the state throughout the year due to intensive crop cultivation, which reduces the soil loss due great extent. Majority of the state area (41%) has the P-value 0.2 to 0.3 and 0.4 to 0.5 and no specific soil conservation measures are required. Remaining areas of the state is having P-values in the range of <0.20, 0.4 to 0.5 and >0.5, respectively.
Improved land and crop production technologies such as contour bunding, contour cultivation and conservation agricultural practices may be adopted to enhance the farm productivity on sustainable basis.
Summary
Quantitative assessment of soil erosion in Punjab state through USLE showed 87.51, 6.31, 2.16, 0.88, 1.72 and 1.42% area was experiencing soil loss in the range of <5, 5- 10, 10-15, 15-20, 20-40 and >40 Mgha-1 yr-1, respectively. To ensure long term sustainability of production systems and environmental security, location specific agronomic, mechanical, and conservation agricultural practices needs to be promoted to minimise soil disturbance. The soil erosion map generated in the study would be extremely helpful for land use planners and policy makers to adopt the best site specific best management practices to bring down the soil erosion rates within the tolerable limit.
Reference:
1. Oldeman, L. R., Global extent of soil degradation. Bi-annual Report. ISRIC, Wageningen, The Netherlands, 1991, pp.19–35.
2. Scherr, S. J. and Yadav, S., Land degradation in the developing world: implications for food, agriculture, and the environment to 2020. Food, Agriculture and the Environment Discussion Paper, 1996.
3. Maji, A. K., Assessment of degraded and wastelands of India,. J Indian Soc Soil Sci., 2007, 4955(4), pp.427 435.
4. Sharda, V. N., and Dogra, P., Assessment of Productivity and Monetary Losses Due to Water Erosion in Rainfed Crops Across Different States of India for Prioritization and Conservation Planning. Agric Res., 2013, 2(4), pp.382–392.
5. Sharda, V. N., Dogra, P. and Prakash, C., Assessment of production losses due to water erosion in rainfed areas of India. Journal of Soil and Water Conservation. 2010, 65 (2), pp.79-91.
6. Singh, G., Ram Babu, Bhusan, L. S. and Abrol, I. P., Soil Erosion Rates in India. J. Soil Water Conservation., 1992,47, pp.97-99.
7. Velayutham, M. and Bhattacharyya, T., Soil Resource Management. In: Natural Resource Management for Agricultural Production in India (Eds. J. S. P. Yadav and G. B. Singh), 2000, pp.1-137.
8. Kurothe, R. S., Batta, R. K. and Sharma, J. P., Soil erosion map of Gujarat. Indian Journal of Soil Conservation, 1997, 25, pp.9-13.
9. Kurothe, R. S., Challa, O., Samra, J. S. and Velayutham, M., Assessment of soil erosion in Maharashtra. Indian Journal of Soil Conservation, 2001, 29, pp.133-137.
10. Sikka, A. K., Selvi, V., Singh, D. V., Madhu, M., Mohanraj, R., Krishnan, P., Srinivas, S., Ramesh, M. and Nair, K. M., Soil erosion map of Kerala state. Indian Journal of Soil Conservation., 2003, 31, pp.127-130.
11. Yadav, R. P. and Sachdev, C. B., Assessment of Soil Erosion in Haryana State. Journal of the Indian Society of Soil Science., 2008, 56, pp.99-105.
12. Yadav, R. P. and Sidhu, G. S., Assessment of Soil Erosion in Himachal Pradesh. Journal of the Indian Society of Soil Science., 2010, 58, pp.212-220.
13. Sur, H. S., Singh, R. and Malhi, S. S., Influence of simulated erosion on soil properties and maize yield in north western munications in Soil Science and plant analysis., 1998, 29 (17-18), pp.2647-2658.
14. Wischmeier, W. H. and Smith, D. D., Predicting rainfall erosion losses - A guide for conservation planning. Agriculture Hand book No. 537, USDA, Washington, D. C., 1978, pp.58.
15. Wischmeier, W. H. and Mannering, J. V., Relation of soil properties to its erodibility. Soil Sci. Soc. Am. Proc., 1969, 33, pp.131-137.
16. Ram Babu., Tejwani, K. G., Agarwal, M. C. and Subhash Chandra., Rainfall erosion potential and iso-erodent map of India. Central Soil and Water Conservation Research and Training Institute, Dehradun., 1978. bulletin No.2. pp.47.
17. Renard, K. G., Laften, J. M., Foster, G. R and McCool, D. K., The revised soil loss equation. In: Soil Erosion - Research methods (R. Lal, Ed.), Soil and Water Conservation Society, Ankeny (U. S.A.), 1994. pp. 105- 124.
18. Sidhu, G. S., Walia, C. S., Lal, Tarsem, Rana, K. P.C. and Sehgal, J., Soils of Punjab for Optimizing Land Use, NBSS publ. 45(Soils of India Series). National Bureau of Soil Survey and Land Use Planning, Nagpur, 1995. pp. 75.
19. Anonymous., District-wise area and production of crops. Directorate of Economics and Statistics, Department of Agriculture and Co-operation, Ministry of Agriculture, Govt. of India, New Delhi, 1998-99.
20. Singh, Gurmel., Ram Babu. and Subhash Chandra., Soil Loss Prediction Research in India. ICAR Bulletin No. T-12/ D-9. Central Soil and Water Conservation Research and Training Institute, Dehradun, 1981. pp.70
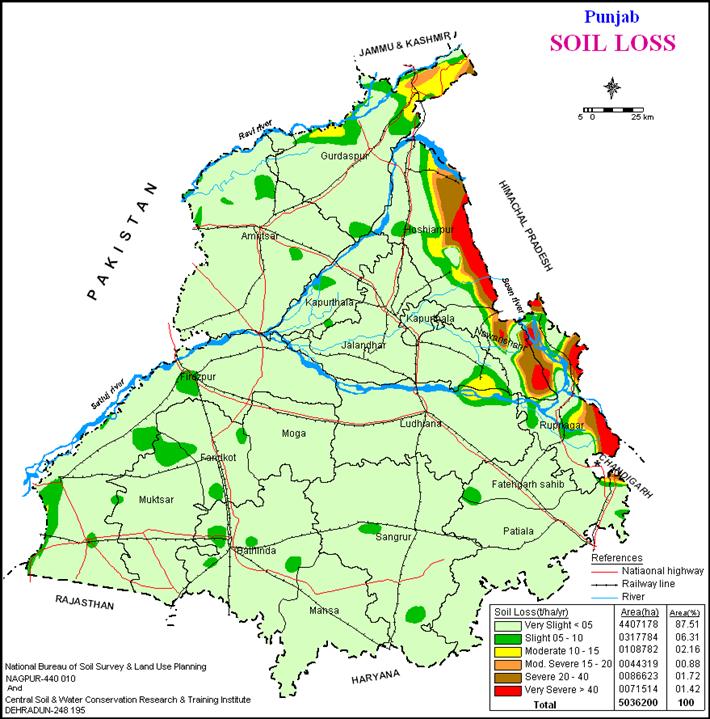
Figure 1: Soil loss (Mgha-1 yr-1 ) map of Punjab
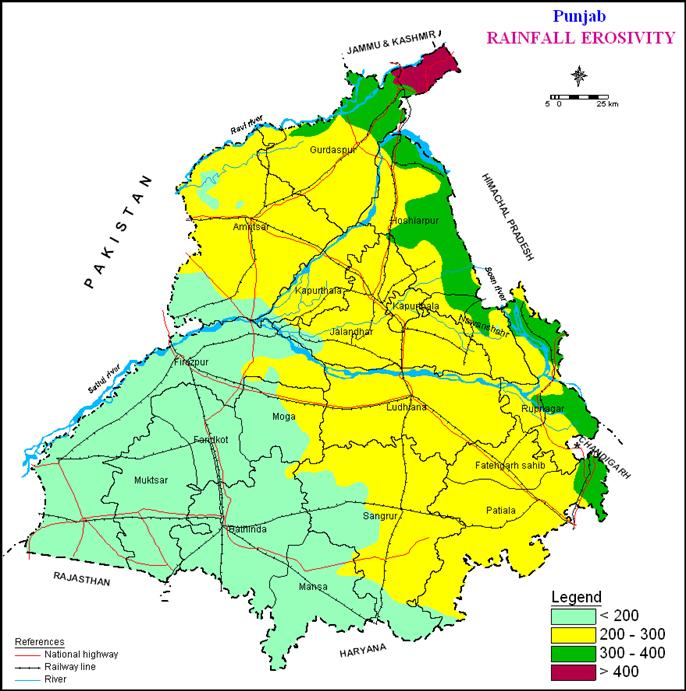 Figure 2: Rainfall erosivity (MJ-mm/ha-hr-yr.) map of Punjab
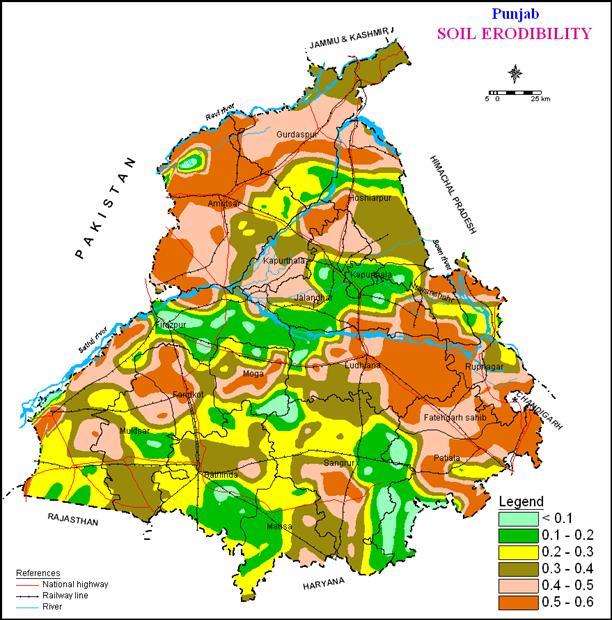
Figure 3: Soil erodibility (Mgha- hr/ha-MJ-mm).map of Punjab
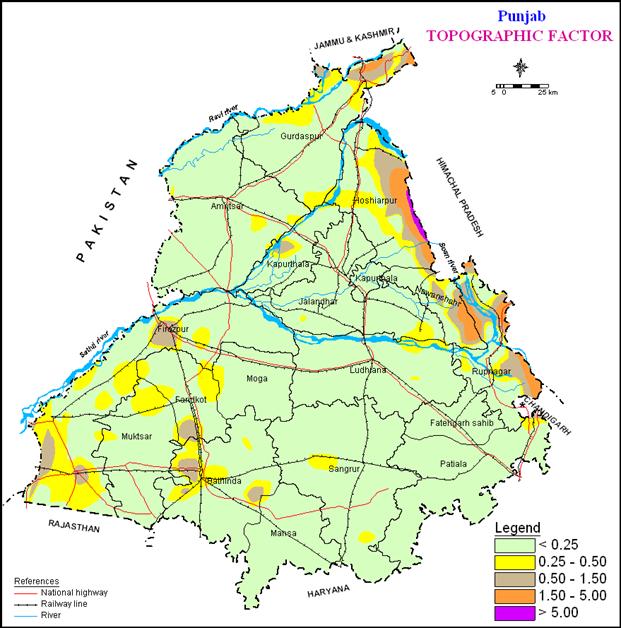 Figure 4: Topographic factor map of Punjab
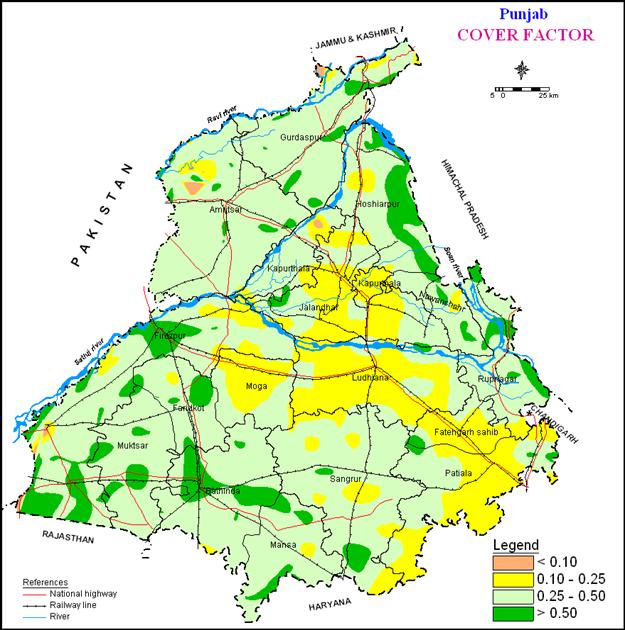
Figure 5: Cover factor map of Punjab
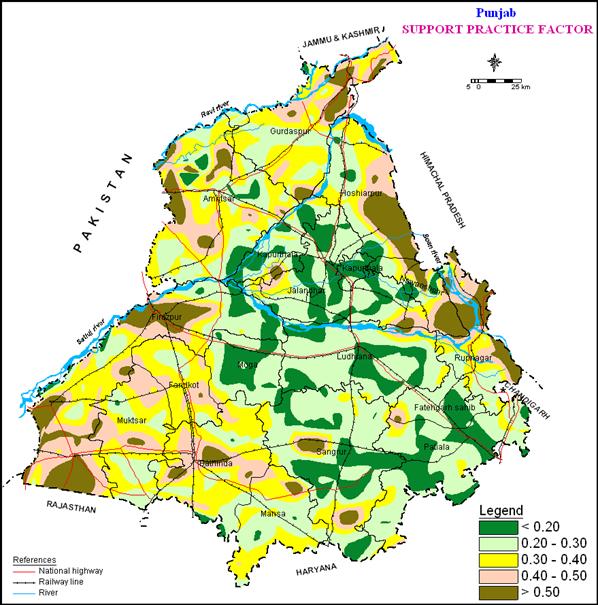
Figure 6: Support practice factor map of Punjab
Table 1. Soil Loss (A-Factor, Mgha-1yr-1), Punjab (Area in sq. km.)
District | Very Slight < 05 | Slight 05 - 10 | Moderate 10 - 15 | Mod. Severe 15 - 20 | Severe 20 - 40 | Very Severe > 40 | ||||||
Area (Sq. km) | Area (%) | Area (Sq. km) | Area (%) | Area (Sq. km) | Area (%) | Area (Sq. km) | Area (%) | Area (Sq. km) | Area (%) | Area (Sq. km) | Area (%) | |
Amritsar | 4940.17 | 96.49 | 197.67 | 3.86 | 0.00 | 0.00 | 0.00 | 0.00 | 0.00 | 0.00 | 0.00 | 0.00 |
Bathinda | 3214.14 | 94.81 | 187.90 | 5.54 | 0.00 | 0.00 | 0.00 | 0.00 | 0.00 | 0.00 | 0.00 | 0.00 |
Faridkot | 1377.67 | 93.09 | 107.60 | 7.27 | 0.00 | 0.00 | 0.00 | 0.00 | 0.00 | 0.00 | 0.00 | 0.00 |
Fatehgarh Sahib | 1125.45 | 95.38 | 58.69 | 4.97 | 0.00 | 0.00 | 0.00 | 0.00 | 0.00 | 0.00 | 0.00 | 0.00 |
Firozpur | 4856.99 | 91.13 | 488.81 | 9.17 | 3.32 | 0.06 | 0.00 | 0.00 | 0.00 | 0.00 | 0.00 | 0.00 |
Gurdaspur | 2463.28 | 69.39 | 576.29 | 16.23 | 393.36 | 11.08 | 97.68 | 2.75 | 16.17 | 0.46 | 0.00 | 0.00 |
Hoshiarpur | 1534.01 | 46.91 | 468.55 | 14.33 | 289.74 | 8.86 | 162.12 | 4.96 | 384.30 | 11.75 | 367.11 | 11.23 |
Jalandhar | 2507.68 | 94.99 | 85.41 | 3.24 | 54.90 | 2.08 | 0.00 | 0.00 | 0.00 | 0.00 | 0.00 | 0.00 |
Kapurthala | 1556.04 | 94.88 | 89.73 | 5.47 | 0.00 | 0.00 | 0.00 | 0.00 | 0.00 | 0.00 | 0.00 | 0.00 |
Ludhiana | 3570.78 | 94.47 | 127.47 | 3.37 | 92.86 | 2.46 | 0.00 | 0.00 | 0.00 | 0.00 | 0.00 | 0.00 |
Mansa | 2186.50 | 100.30 | 0.81 | 0.04 | 0.00 | 0.00 | 0.00 | 0.00 | 0.00 | 0.00 | 0.00 | 0.00 |
Moga | 2231.77 | 100.08 | 5.69 | 0.26 | 0.00 | 0.00 | 0.00 | 0.00 | 0.00 | 0.00 | 0.00 | 0.00 |
Mukatsar | 2447.35 | 93.41 | 181.96 | 6.94 | 0.00 | 0.00 | 0.00 | 0.00 | 0.00 | 0.00 | 0.00 | 0.00 |
Nawanshahr | 568.00 | 47.73 | 115.79 | 9.73 | 82.86 | 6.96 | 81.29 | 6.83 | 218.48 | 18.36 | 95.71 | 8.04 |
Patiala | 3559.44 | 97.52 | 60.04 | 1.65 | 16.98 | 0.47 | 9.86 | 0.27 | 13.02 | 0.36 | 1.14 | 0.03 |
Rupnagar | 943.86 | 46.73 | 303.71 | 15.04 | 153.84 | 7.62 | 92.89 | 4.60 | 234.31 | 11.60 | 251.19 | 12.44 |
Sangrur | 4988.59 | 98.01 | 120.99 | 2.38 | 0.00 | 0.00 | 0.00 | 0.00 | 0.00 | 0.00 | 0.00 | 0.00 |
Total | 44071.73 | 3177.11 | 1087.87 | 443.85 | 866.29 | 715.16 |
