

Партнерка на США и Канаду по недвижимости, выплаты в крипто
- 30% recurring commission
- Выплаты в USDT
- Вывод каждую неделю
- Комиссия до 5 лет за каждого referral
DOI
10.14341/DM8265
Даты
Received: 16.12.2016. Accepted: 15.02.2017.
Тип статьи
ORIGINAL STUDY
Название статьи
Разработка и проверка работы ПИД-регулятора для искусственной поджелудочной железы с интраперитонеальным введением инсулина
Авторы
1, 1, 2, 1, 2
Организации
1ФГБУ «НМИЦ Эндокринологии» Минздрава России, Москва, Россия
2ФГАОУ ВПО «Московский физико-технический институт (государственный университет)», Москва, Россия
аннотация
ОБОСНОВАНИЕ. Эффективность лечения сахарного диабета 1 типа (СД1) можно значительно повысить при использовании искусственной поджелудочной железы (ИПЖ) – устройства или технологии, позволяющей автоматически управлять гликемией. В основе ИПЖ лежит управляющий алгоритм, задачей которого является регуляция доз вводимого пациенту инсулина в зависимости от информации об уровне глюкозы в крови таким образом, чтобы эффективно удерживать концентрацию глюкозы у пациента в заданном интервале. К настоящему времени разработан ряд теоретических моделей функционирования таких устройств, часть из них уже проходят клинические или экспериментальные испытания.
ЦЕЛЬ. В этой работе мы оценивали эффективность работы контроллера для управления автоматической доставкой инсулина в ИПЖ, конструкция которого создана на основе пропорционально-интегрально-дифференциального (ПИД) алгоритма, используя фармакокинетические параметры инсулина при его интраперитонеальном (ИП) введении.
МЕТОДЫ. Оценка работы контроллера проводилась в виртуальной среде InSilico (при помощи математического моделирования, без участия живых участников) с использованием метаболического тренажера UVA/Padova на 10 пациентах. Схема контроллера использовала параметры фармакокинетики и фармакодинамики инсулина при условии введения его в ИП-пространство и основывалась на ПИД-контроллере с обратной связью для обеспечения безопасной и эффективной доставки инсулина.
РЕЗУЛЬТАТЫ. Предложенная конструкция контроллера позволила достигать виртуальным пациентам 83% времени в пределах гликемического диапазона 70-140 мг/дл (3,9-7,8 ммоль/л) при полном отсутствии эпизодов гипогликемии.
ЗАКЛЮЧЕНИЕ. Полученные результаты могут служить обоснованием для проведения исследований разработанного контроллера с участием живых объектов in vivo для оценки его эффективности и безопасности.
Ключевые слова:
искусственная поджелудочная железа; интраперитонеальное введение инсулина; in silico; управляющий алгоритм; инсулиновая помпа; доклинические исследования
Title
Development and in silico validation of the PID-algorithm for the artificial pancreas with intraperitoneal insulin delivery
Authors
Vladimir A. Karpelyev1, Yury I. Philippov1, Artem V. Averin2, Maxim D. Boyarskiy1, Dmitry A. Gavrilov2
Affiliation
1Endocrinology Research Centre, Moscow, Russian Federation
2Moscow Institute of Physics and Technology, Moscow, Russian Federation
Abstract
BACKGROUND: The efficacy of the treatment of type 1 diabetes can be markedly improved using artificial pancreas (AP), which is a technology to automatically control blood glucose levels. In this paper, we propose the construction of a controller for controlling the automated delivery of insulin in AP based on a proportional–integral–derivative (PID) algorithm using intraperitoneal (IP) insulin delivery.
METHODS: The project used rapid-acting insulin in the IP space when setting up a PID controller with feedback to ensure the safe and efficient delivery of insulin. The controller was configured to satisfy feedback insulin present in blood. Controller check was performed In Silico using the metabolic simulator UVA|Padova T1DMS on 10 virtual patients.
RESULTS: The proposed controller design has time to reach 83% within the glycaemic range of 70–140 mg/dl (3.9–7.8 mmol/l), without time spent in hypoglycaemia.
CONCLUSIONS: In a future study we plan to test this controller in vivo to evaluate its performance in vivo.
Keywords:
аrtificial pancreas; intraperitoneal insulin infusion; in silico; control algorithm; insulin pump; preclinical studies
Introduction
To prevent the development of diabetes mellitus (DM) complications, blood glucose (BG) concentrations need to be maintained near physiological levels. Intensive insulin therapy is the most effective method to achieve the desired glycaemic values in patients with type 1 diabetes (T1D). This necessitates an independent calculation of insulin doses by the patient based on BG concentration, amount of carbohydrates in the planned food intake, physical activity and other information. The difficulties that most patients with T1D inevitably face when performing intensive insulin therapy prevent a majority of them from achieving their treatment goals.
The latest technical achievements eliminate some of the complexities of DM management and ensure the achievement of better results. Thus, compared with multiple insulin injections, the use of insulin pumps for continuous subcutaneous insulin infusion (CSII) allows a significantly greater proportion of patients to achieve targeted BG values.[1] Another important technical achievement is the development of devices for continuous glucose monitoring (CGM).[2] CSII together with CGM enables patients with DM to control glycaemia much more efficiently than before. However, such wide opportunities for managing the disease have certain limitations: the efficiency of the treatment greatly depends on patients themselves—their level of knowledge and skills, motivation, personal qualities and many other factors, including unpredictable mood changes inherent in all people. Thus, patients often find themselves being the main obstacle hindering the achievement of treatment goals.
As such, scientists have been looking forward to the creation of an artificial pancreas (AP), which is a closed-loop system that would automatically and effectively manage the glycaemia of patients with diabetes, thereby eliminating the human factor from the treatment results. In most cases, scientists define an AP as an insulin pump that automatically releases insulin based on glycaemia information using a control algorithm that will close the ‘decision contour’. The system should work on the principle of feedback and maintain glycaemia within the specified range. Quantitatively, the purpose of an AP is to maintain the BG concentrations within a fairly narrow physiological range (3.9–7.8 mmol/L) for as long as possible.
Different AP variants have already been tested in clinical studies, and some are being tested in outpatient settings.[3;4] Nevertheless, one of the most important considerations for success is the extremely slow pharmacokinetics of insulin (and its genetically engineered analogues with ultrashort action) at a rather high rate of glycaemic change under the influence of external factors, which prevents the effective prediction of glycaemic values and correction of insulin dosing. The working version of the AP should ensure that glycaemia is maintained within the specified range, despite errors in CGM data and the prolonged action of insulin. The most difficult task is maintaining glycaemia during rapid changes in the levels thereof, for example, the rapid increase in glycaemia after eating.
One method for solving this problem is the use of alternative methods for delivering insulin into the body, including permanent intravenous (IV) or intraperitoneal (IP) infusions.[5] IP insulin infusions[6] have been utilized since the 70s.[7] Insulin administered intraperitoneally has different pharmacokinetic and pharmacodynamic characteristics than that administered subcutaneously: the peak insulin concentration following subcutaneous injections occurs after 50–60 min[8], whereas that following IP infusions occurs after 20–25 min.[9] Another difference is with regard to the reduction of blood insulin concentrations; subcutaneously injected insulin is eliminated within 6–8 h,[8] whereas insulin administered intraperitoneally is completely eliminated within 1–2 h.[9]
Several management strategies have been considered for application in the AP, including proportional–integral–differential (PID) control and the intelligent management model.[3] The intelligent management model, which uses subcutaneous insulin administration despite perceiving large delays in these systems, was proposed as an appropriate strategy for AP structures.[10] The use of IP insulin administration resulted in notably less system delays in response to events (insulin administration). In such cases, we expect the PID controller to provide satisfactory results. Given that insulin acts quickly, the system can work well without serious predictive elements suggested by the intelligent management model.
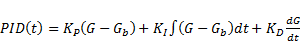
The PID algorithm (controller) is based on an algorithm used for the calculation of the insulin injection rate PID(t), which is mathematically defined as follows:[11]
 (1)
(1)
The parameter t indicates time; the parameters KP, KI and KD indicate the relative weights of the proportional, integral and differential components, respectively and G and Gb represent the patient’s glucose concentration and basal (target) glucose concentration, respectively. The proportional response of the individual components refers to the response to the control action in proportion to the difference between the measured BG concentration and its desired value, the differential response reproduces the known first phase of insulin release by the ? cell and the integral response reproduces the second phase, which is the phase of stable insulin release. These responses include low-frequency and differential filters, resulting in some delays in the proportional and integral responses and the expansion of the differential response.
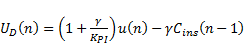
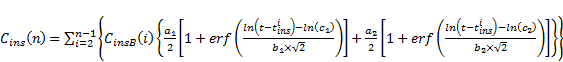
For insulin dosing in closed-loop conditions, the PID controller is implemented as follows:[12]
 (2)
(2)
where UD is the rate of insulin delivery, Cins(n) is the estimated insulin concentration in blood plasma, n is the time step number and KPI and ? are the coefficients, the values of which are given in Table 1.
Table 1. Parameters of the PID controller for IP insulin administration
Parameter | Parameter dimension | Parameter value |
?С | min | 40 |
?I | min | 273 |
?D | min | 23.5 |
? | - | 0.1 |
? | - | 0.04 |
? | min-1 | 0.5 |
KPI | min-1 | 1 |
a1 | pmol | 7.17 ? 10-6 |
a2 | pmol | -6.70 ? 10-6 |
b1 | - | 1.0 |
b2 | - | 0.28 |
c1 | min | 38.2 |
c2 | min | 114.9 |
TDI | U | 60 |
Gsp | mg/mL | 120 |
?t | min | 5 |
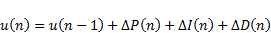
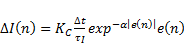
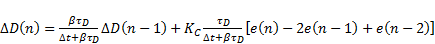
Moreover, u(n) is the rate of insulin delivery, which is calculated by the controller according to the following formula:
 (3)
(3)
, where 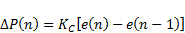
 (4)
(4)

 (5)
(5)
 (6)
(6)
 (7)
(7)

 (8)
(8)
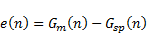
In these equations, P, I and D represent the proportional, integral and differential components of the action, respectively.
?t is the time step (5 min), Gsp is the target value of glucose concentration, Gm is the measured glucose concentration, TDI is the daily dose of insulin and ?I, ?D, ?C, ? and ? are the parameters of the model.
The key mathematical feature of physiological glycaemia control in a healthy person is the suppression of further insulin production when insulin is present in the blood.[13] Most of the studies that used PID control with subcutaneous insulin administration included this function using an insulin feedback algorithm.[14, 15] In our case, the feedback is performed using the addend in expression (2). Given that measuring the plasma insulin concentration Cins(t) in real time is not currently possible, the method for assessing the concentration of insulin in blood plasma is based on the insulin pharmacokinetics model. Coefficients in the model are calculated using experimental data on insulin administration.
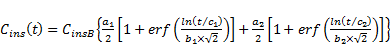
In the previously proposed model[16], the response of plasma insulin, Cins(t), to the administration of an insulin bolus is characterized by the following equation:
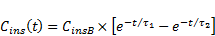
 (9)
(9)
This equation is based on the assumption that the diffusion of insulin into the tissues and the elimination of insulin from the body depend on its concentration. The parameters ?1 and ?2 are time constants that determine how fast the insulin concentration increases and decreases, whereas the parameter CinsB determines the dose of insulin for bolus administration. The total change in plasma insulin concentrations from a plurality of bolus injections was determined using linear summation, and the coefficients were determined using the nonlinear least squares method. The aforementioned method for processing experimental data[17] showed that equation (9) does not satisfactorily describe the change in blood plasma insulin concentrations relative to the time after bolus IP insulin administration (Fig. 1), with the root-mean-square error being ±187 ?U/mL.
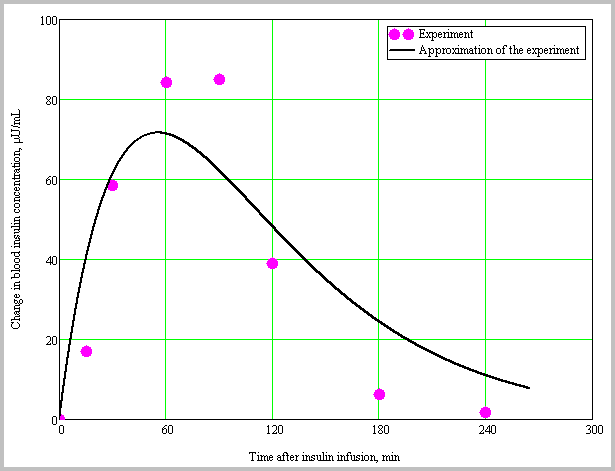
Fig. 1. Results of experimental data processing[17] for IP insulin administration using equation (9).
The current study uses a modified model for describing the pharmacokinetics of insulin with IP administration. To calculate the change in plasma insulin concentration in response to bolus IP insulin administration, the following equation was used:
 (10)
(10)
where a1, a2, b1, b2, c1 and c2 are the coefficients. The first term within the curly brackets determines the amount of insulin released into the blood, and the second term determines the amount of insulin eliminated therefrom. Based on the nonlinear least squares method using the Mathcad system and experimental data on IP insulin administration[17], the coefficients a1, a2, b1, b2, c1 and c2 in equation (10) were determined. The values of the coefficients are shown in Table 1, and the processing results are provided in Fig. 2.
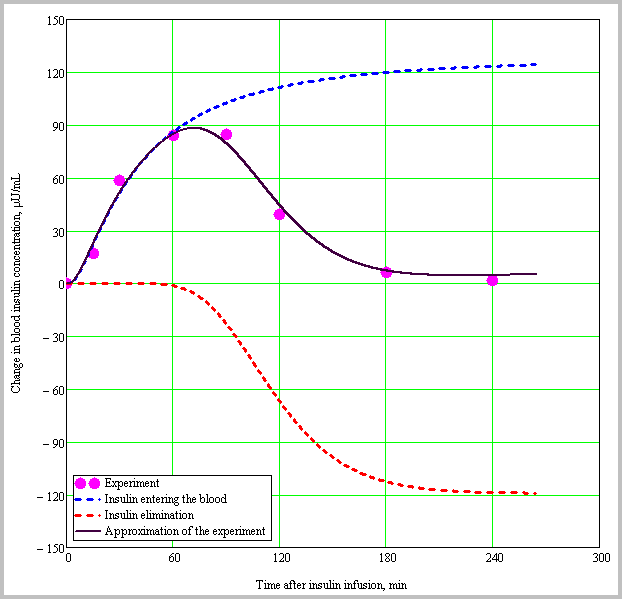
Fig. 2. Results of experimental data processing[17] for the IP administration of insulin using equation (10).
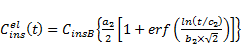
Expression (10) proved to be more suitable for describing the pharmacokinetics of IP insulin administration, with the root-mean-square error being ±9 ?U/mL. Moreover, changes in blood plasma insulin concentrations in response to bolus IP injections can be categorized into two components. The first component is the release of insulin into blood plasma, and the second component is the elimination of insulin therefrom. Insulin release can be determined using the following equation:
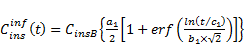
 (11)
(11)
where 
 is the concentration of insulin entering the plasma. Meanwhile, insulin elimination is determined using the following expression:

 (12)
(12)
where 
 is the concentration of insulin being eliminated.
To match the sampling period of the model with that of the controller, the following equation is provided:
 (13)
(13)
where Cins(n) is the assumed blood insulin concentration, ![]()
![]() is the amount of insulin administered at the ith time step and
is the amount of insulin administered at the ith time step and ![]() is the end time of the ith step. Furthermore,
is the end time of the ith step. Furthermore, ![]()
![]() , where t and t0 is the current time and start time of insulin infusion, respectively.
, where t and t0 is the current time and start time of insulin infusion, respectively.
Transferring the control of insulin administration from a human to a mathematical AP algorithm is challenging, particularly from the biomedical ethics standpoint. Hence, substantial evidence for the safety and efficiency of the operation, the control algorithm itself and the whole AP system is imperative. During the preclinical stage, the efficiency and safety of the control algorithm is generally evaluated using simulations. Researchers from the University of Virginia (USA) and the University of Padua (Italy) developed the UVA/Padova metabolic simulator to facilitate the development of AP algorithms and their virtual testing (in silico), which, under the approval of the Food and Drug Administration (USA), forgoes the need for using laboratory animals during preclinical testing.[18–20]
Aim
The present study was conducted to preclinically evaluate the efficiency of the control algorithm in controlling IP insulin infusion using an insulin pump.
Methods
The conditions for a prospective, uncontrolled and nonrandomized study involving virtual patients were created by computer simulation (in silico).
The sampling of virtual subjects for in silico studies is based on real individual data and covers the observed variability of key parameters in the general human population.[19] The sample for this study included 10 virtual adult subjects. Table 2 represents the key demographic and metabolic parameters of these subjects.
Table 2. Key demographic and metabolic parameters of in silico subjects available in the simulation environment
Parameter | Mean ± SD | Minimum value | Maximum value |
Average weight, kg | 79.7±12.8 | 52.3 | 118.7 |
Insulin, U/day | 47.2±15.2 | 21.3 | 98.4 |
Carbohydrate coefficient, g/U | 10.5±3.3 | 4.6 | 21.1 |
Fasting glucose, mg/dL | 143.4±9.33 | 122.1 | 167.1 |
The effect of insulin on glucose elimination, 10-2 mg/kg/min per pmol/L | 3.82±1.34 | 1.08 | 8.08 |
Our study used the UVA/Padova T1DMS Metabolic Simulator (Alere Informatics Inc., D/B/A, The Epsilon Group) to evaluate the efficiency of the control algorithm for the insulin dosage control system. The simulation software is an add-on to the MATLAB software package (the current work used version v. R2016b with the SimuLink package, MathWorks, USA). The scheme of the metabolic simulator used in this paper is shown in Figure 3.
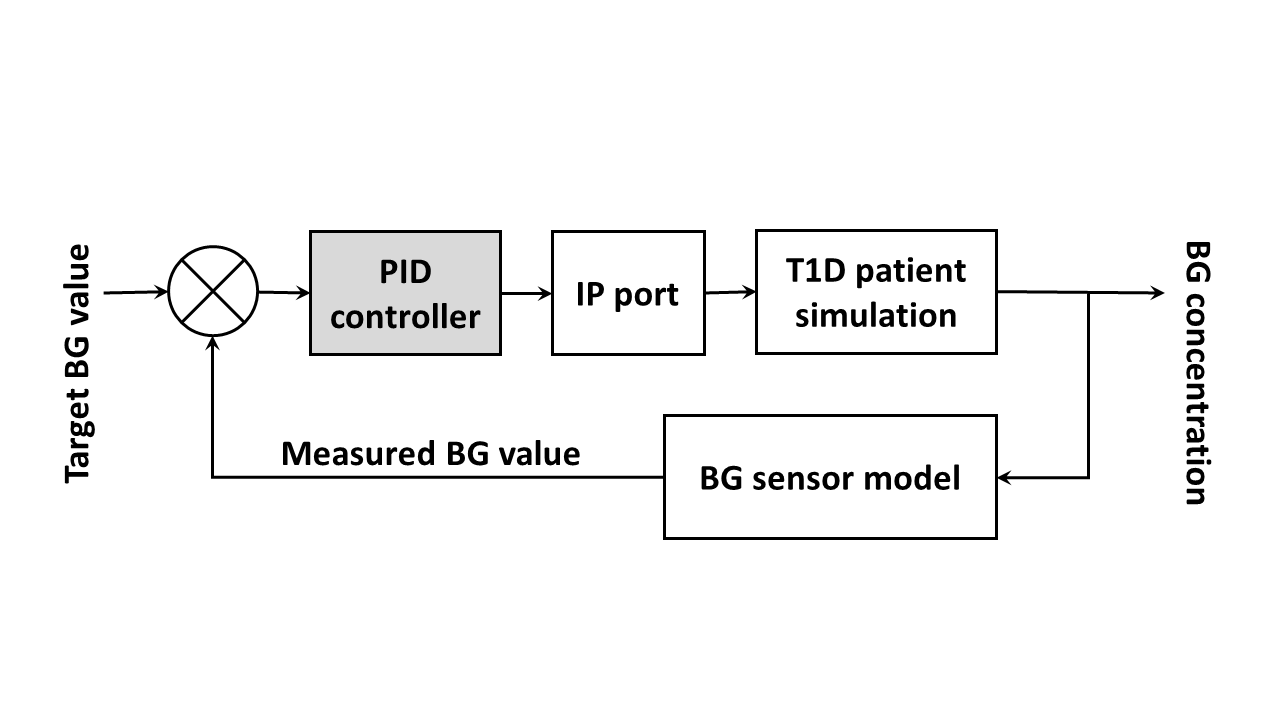
Fig. 3. Block diagram for the configuration of the UVA/Padova metabolic simulator used for testing the PID controller of the AP.
To establish a model of IP insulin administration, we used the pharmacokinetic and pharmacodynamic parameters observed in IV insulin administration.[21] Glycaemic data for virtual patients were obtained from a model of a subcutaneous BG sensor.
A 31-h clinical scenario was modelled using the T1DMS metabolic simulator to evaluate the performance of the control algorithm during a typical real-life scenario. Closed-loop control for each virtual subject was started at 02:00. Breakfast, lunch and dinner that contained 40, 50 and 70 g of carbohydrates was served at 07:00, 12:00 and 19:00, respectively. Closed-loop control was then completed at 07:00 the following day.
The control algorithm of the insulin dosing control system was tested in silico, which eliminated the need for the use of any human or animal subjects. As part of the simulation, we have created virtual subjects with T1D who received insulin pump therapy through a special permanent long-term laparoscopic port. The only clinically available product of this kind is DiaPort (Roche, Germany).
The efficiency of the control algorithm was assessed using glycaemic control indicators in the virtual subjects created within the framework of the simulation software:
- the mean value of glycaemia during the day; the proportion of time spent within the normal glycaemic range of 70–140 mg/dL (3.9–7.8 mmol/L); the proportion of time spent in hyperglycaemia [>180 mg/dL (10 mmol/L)]; the proportion of time spent in hypoglycaemia [<70 mg/dL (3.9 mmol/L)]; and the maximum and minimum values of glycaemia for the estimated period.
Within the framework of mathematical modelling, we used data on BG concentrations of virtual patients, which were obtained by simulating the function of a CGM system based on a subcutaneously implanted glucose oxidase sensor.
Ethical expertise. The present study did not involve living subjects or personalized medical data, which eliminated the need for ethical examination of the study protocol.
Statistical analysis
The study used a standard sample size of 10 virtual subjects with ages (adults) similar to those used in In Silico pilot studies. For statistical processing, MS Excel 2010 was used. Moreover, quantitative results are presented as M (mean) ± SD (standard deviation) considering the parametric distribution of data obtained during the course of mathematical modelling.
Results
The modelling results are shown in Figure 4 and provided in Table 3.

Fig. 4. BG concentration (A) and insulin infusion rate (B) for the proposed controller design were evaluated in silico in 10 adult subjects using a 31-h scenario. Black horizontal lines in panel (A) show the range of acceptable glycaemia values (70–180 mg/dL). Panel (B) presents data on the insulin infusion rate. Thick middle lines show the average of 10 subjects, and thin lines show the standard deviation of the values.
Table 3. Results of the modelled PID algorithm
Maximum BG value, mg/dL (mmol/L) | Minimum BG value, mg/dL (mmol/L) | Proportion of time spent within 70–140 mg/dL (3.9–7.8 mmol/L), % | Proportion of time spent at <70 mg/dL (3.9 mmol/L), % | Proportion of time at >180 mg/dL (10 mmol/L), % | Source |
184 ± 13 (10.2±0.7) | 107 ± 2 (5.9±0.1) | 83 ± 9 | 0 ± 0 | 1 ± 3 | Present work |
196 ± 14 (10.9±0.8) | 93 ± 7 (5.2±0.4) | 78 ± 6 | 0 ± 0 | 5 ± 4 | [12] |
Discussion
The efficacy of the modernized PID controller with feedback during insulin infusion into the IP space was verified in silico using the UVA/Padova metabolic simulator in 10 patients. In the proposed controller design, the proportion of time spent within the glycaemic range of 70–140 mg/dL (3.9–7.8 mmol/L) was 83%, without spending any time in hypoglycaemia. Moreover, the proportion of time spent within the acceptable glycaemic zone of 70–180 mg/dL (3.9–10.0 mmol/L) was 99%.
The simulation results of the present study were consistent with those of a PID controller similar in construction,[12] which used a 27-h scenario with three meals. The proposed control algorithm prevented both hypoglycaemia and prolonged maintenance of glucose concentrations >180 mg/dL (10 mmol/L) in virtual patients.
The AP, which uses IP insulin administration, has great potential for significantly improving glycaemic control when used in a closed loop. Given that IP insulin administration has faster pharmacokinetic and pharmacodynamic characteristics than subcutaneous insulin administration, the AP enables rapid BG control in cases of glycaemic disorders. Moreover, the rapid elimination of IP insulin leads to a lower risk for developing hypoglycaemia[22] resulting from the action of insulin remaining in the blood.
During the development of the PID controller, the current study used a new model to describe the pharmacokinetics of insulin, which apparently describes the experimental data more accurately than previously suggested.[16] Thus, during the processing of experimental data on plasma insulin concentrations, the root-mean-square error calculated according to formula (9) from[16] was ±187 ?U/mL, whereas that calculated according to formula (10) with our approach was ±9 ?U/mL. This is significant because feedback for insulin is an important addition to the AP controller, which imitates the physiology of the human body. An increase in plasma insulin concentrations inhibits the delivery of a greater amount of insulin, which results in the reduction of insulin stores and a reduced risk of hypoglycaemia.
Study limitations. Data from mathematical modelling cannot be implicitly extrapolated to animals and humans. Therefore, the current study is only the first of a series of planned tests. Despite the use of a homogeneous sample of patients, the sample size cannot be considered sufficient to obtain convincing data on the significant advantages of the developed algorithm over other analogues. Further research, including those conducted in silico, with a significantly greater number of subjects and direct comparisons among control algorithms in a single sample is required.
Conclusion
An AP that works within the IP space provides a solution to many of the problems associated with subcutaneous insulin administration. The rapid insulin transport and action allow the control algorithm to maintain good glycaemic control. During the development of the PID controller for the AP, a new model that describes the pharmacokinetics of insulin was introduced to improve the feedback of insulin as well as the efficiency of the control algorithm. The proposed algorithm can be improved by developing more accurate models based on experimental data. Once these data are collected and analysed, the updated controller can be evaluated in an in vivo animal model.
Дополнительная информация.
Источник финансирования. Работа проведена при поддержке Российского научного фонда (грант №14-25-00181).
Конфликт интересов. Авторы декларируют отсутствие явных и потенциальных конфликтов интересов, связанных с публикацией настоящей статьи.
Список литературы | References
Pickup J, Keen H. Continuous subcutaneous insulin infusion at 25 years: evidence base for the expanding use of insulin pump therapy in type 1 diabetes. Diabetes Care. 2002;25(3):593-598. Bergenstal RM, Tamborlane WV, Ahmann A, et al. Effectiveness of sensor-augmented insulin-pump therapy in type 1 diabetes. N Engl J Med. 2010;363(4):311-320. doi: 10.1056/NEJMoa1002853 Doyle FJ, 3rd, Huyett LM, Lee JB, et al. Closed-loop artificial pancreas systems: engineering the algorithms. Diabetes Care. 2014;37(5):1191-1197. doi: 10.2337/dc13-2108 Dassau E, Renard E, Place J, et al. Intraperitoneal insulin delivery provides superior glycaemic regulation to subcutaneous insulin delivery in model predictive control-based fully-automated artificial pancreas in patients with type 1 diabetes: a pilot study. Diabetes, Obesity and Metabolism. 2017;19(12):1698-1705. doi: 10.1111/dom.12999 Spaan NA, Teplova AE, Renard E, Spaan JA. Implantable insulin pumps: an effective option with restricted dissemination. Lancet Diabetes Endocrinol. 2014;2(5):358-360. doi: 10.1016/S2213-8587(14)70035-X Karpel'ev VA, Fedorova EAe, Philippov YI, et al. Intraperitoneal insulin infusion: on the way to the artificial pancreas. Diabetes mellitus. 2015;18(3):32. doi: 10.14341/dm2015332-45 Botz CK, Leibel BS, Zingg W, et parison of peripheral and portal routes of insulin infusion by a computer-controlled insulin infusion system (artificial endocrine pancreas). Diabetes. 1976;25(8):691-700. Homko C, Deluzio A, Jimenez C, et parison of insulin aspart and lispro: pharmacokinetic and metabolic effects. Diabetes Care. 2003;26(7):2027-2031. Schaepelynck Belicar P, Vague P, Lassmann-Vague V. Reproducibility of plasma insulin kinetics during intraperitoneal insulin treatment by programmable pumps. Diabetes Metab. 2003;29(4 Pt 1):344-348. Grosman B, Dassau E, Zisser HC, et al. Zone model predictive control: a strategy to minimize hyper - and hypoglycemic events. J Diabetes Sci Technol. 2010;4(4):961-975. doi: 10.1177/193229681000400428 Steil GM, Panteleon AE, Rebrin K. Closed-loop insulin delivery-the path to physiological glucose control. Adv Drug Deliv Rev. 2004;56(2):125-144. Huyett LM, Dassau E, Zisser HC, Doyle FJ, 3rd. Design and Evaluation of a Robust PID Controller for a Fully Implantable Artificial Pancreas. Ind Eng Chem Res. 2015;54(42):10311-10321. doi: 10.1021/acs. iecr.5b01237 Argoud GM, Schade DS, Eaton RP. Insulin suppresses its own secretion in vivo. Diabetes. 1987;36(8):959-962. Steil GM, Palerm CC, Kurtz N, et al. The effect of insulin feedback on closed loop glucose control. J Clin Endocrinol Metab. 2011;96(5):1402-1408. doi: 10.1210/jc.2010-2578 Palerm CC. Physiologic insulin delivery with insulin feedback: a control systems put Methods Programs Biomed. 2011;102(2):130-137. doi: 10.1016/j. cmpb.2010.06.007 Steil GM, Rebrin K, Darwin C, et al. Feasibility of automating insulin delivery for the treatment of type 1 diabetes. Diabetes. 2006;55(12):3344-3350. doi: 10.2337/db06-0419 Nathan DM, Dunn FL, Bruch J, et al. Postprandial insulin profiles with implantable pump therapy may explain decreased frequency of severe hypoglycemia, compared with intensive subcutaneous regimens, in insulin-dependent diabetes mellitus patients. Am J Med. 1996;100(4):412-417. doi: 10.1016/S0002-9343(97)89516-2 Patek SD, Bequette BW, Breton M, et al. In silico preclinical trials: methodology and engineering guide to closed-loop control in type 1 diabetes mellitus. J Diabetes Sci Technol. 2009;3(2):269-282. doi: 10.1177/193229680900300207 Kovatchev BP, Breton M, Man CD, Cobelli C. In silico preclinical trials: a proof of concept in closed-loop control of type 1 diabetes. J Diabetes Sci Technol. 2009;3(1):44-55. doi: 10.1177/193229680900300106 Man CD, Micheletto F, Lv D, et al. The UVA/PADOVA Type 1 Diabetes Simulator: New Features. J Diabetes Sci Technol. 2014;8(1):26-34. doi: 10.1177/1932296813514502 Lee JJ, Dassau E, Zisser H, Doyle FJ, 3rd. Design and in silico evaluation of an intraperitoneal-subcutaneous (IP-SC) artificial put Chem Eng. 2014;70:180-188. doi: 10.1016/pchemeng.2014.02.024 Liebl A, Hoogma R, Renard E, et al. A reduction in severe hypoglycaemia in type 1 diabetes in a randomized crossover study of continuous intraperitoneal compared with subcutaneous insulin infusion. Diabetes Obes Metab. 2009;11(11):1001-1008. doi: 10.1111/j.1463-1326.2009.01059.xИнформация об авторах [Authors info]
* [Yury I. Philippov, MD]; Адрес: 117036, [address: 11 Dm. Ulyanova street, 117036 Moscow, Russia]; E-mail: *****@***com; phone: +7(926)3294723; ORCID: http://orcid. org/0000-0002-0317-6592; eLibrary SPIN-код: 5678-0839.
[Vladimir A. Karpelyev]; E-mail: *****@***ru
[Artem V. Averin]; E-mail: *****@***ru; ORCID: http://orcid. org/0000-0002-4867-3533; eLibrary SPIN-код: 2306-2443
[Maxim D. Boyarsky]; E-mail: mia. *****@***com; ORCID: http://orcid. org/0000-0002-8821-3435; eLibrary SPIN-код: 2956-4410
, к. ф-т. н. [Dmitriy A. Gavrilov, PhD]; E-mail: gavrilov. *****@***ru; ORCID: http://orcid. org/0000-0002-0627-8500; eLibrary SPIN-код: 3430-9670
Цитировать:
, , Разработка и проверка работы ПИД-регулятора для искусственной поджелудочной железы с интраперитонеальным введением инсулина // Сахарный диабет. — 2017. — Т. 20. — №6. — С. xxx-xxx. doi: 10.14341/DM8265
To cite this article:
Karpelyev VA, Philippov YI, Averin AV, Boyarskiy MD, Gavrilov DA. Development and in silico validation of the PID-algorithm for the artificial pancreas with intraperitoneal insulin delivery. Diabetes mellitus. 2017;20(6):xxx-xxx. doi: 10.14341/DM8265
