


Партнерка на США и Канаду по недвижимости, выплаты в крипто
- 30% recurring commission
- Выплаты в USDT
- Вывод каждую неделю
- Комиссия до 5 лет за каждого referral
The total volume of the private deposit market in the region comprises 88.9 bln rubles as of 01.01.2009. During 2008 the gain of funds on the accounts of the individual deposits was equal to 8.9% (in 2007 – 34.3%). There is a tendency for decrease of the share of private deposits in the total amount of funds attracted by the banks of the region: from 36.3% as of the start of the year till 31.4% as of 01.01.2009. The growth rate of the private deposits in the Sberbank’s branches is ahead of the similar figures of regional banks and branches of the banks from other regions: 120.6%, 102.5% and 92.4% correspondently. CHELINDBANK is the leading bank of the region by attracted private funds among regional banks. The share of the Bank in the market of private deposits remained almost unchanged since the beginning of the year: 11.8% as of 01.01.2008 and 11.6% as of 01.01.2009.
The volume of private lending in the region comprised 87.9 bln rubles as of 01.01.2009 including share of the regional banks in the amount of 16.1 bln rubles. The growth rate of the loan portfolio of private customers in 2008 was equal to 34% that was 2.2 times less than the similar figure in 2007. Upon the results of 2008 the share of CHELINDBANK in the private lending market was insufficiently decreased – from 6.8% till 6.2%, and that became the general tendency for major regional banks and Sberbank.
The main competitors of CHELINDBANK in the banking market of Chelyabinsk region are Sberbank, Chelyabinvestbank and branches of major Moscow and Yekaterinburg banks.
II. PRIORITIES IN CHELINDBANK PERFORMANCE
Strategy for development of CHELINDBANK is represented by the following main documents approved by the Board of Directors of the Bank:
- Mission of the Bank,
- Conception for development of the Bank for and Main Areas of Performance of the Bank for ,
- Key performance indexes of the Bank for ,
- Product and market strategies of development of the Bank for .
While developing the Strategy the Key factors of success have been defined for the banking sector:
In financial area – capital adequacy, capital availability, risk minimization, business profitability.
In customers and marketing area – stable customers’ database, wide network of retail sales, good reputation, recognized brand.
In terms of business processes – modern informational technologies, usage of Internet technologies, fast development and implementation of new services.
In terms of the Personnel – professional skills of the employees, satisfaction of the staff, efficiency of performance.
In accordance with Conception for development of the Bank the main objective of CHELINDBANK for the period till 2010 was increase of the efficiency of the banking performance due to provision of quality banking services for enterprises, companies and their employees, sole traders and private customers of the Urals region.
It is stated for the period till 2010 that CHELINDBANK will continue its development as the major universal bank of the Urals region, and the main business activities of the Bank will be concentrated in Chelyabinsk region. CHELINDBANK has stable group of customers. The Strategy of the Bank prescribes that the main efforts of the Bank will be aimed at retention of the existing customers’ database. The annual gain of the number of Customers in terms of corporate customers and sole traders is foreseen at the level of not less than 10%. This forecast is based on future development of mutually beneficial relations with Customers.
Deposits of private customers constitute the core of resources of the Bank. Not less than 60% of private deposits of the Bank should consist of deposits with a term of more than 1 year. It will be possible to ensure the required gain of private deposits by means of offering attractive competitive interest rates and different ways of management of deposit accounts to the customers. Settlement and other account balances comprise more than 70% of corporate funds in the Bank. Increase of funds on the Customers’ accounts contributes to the growth of commission incomes of the Bank and is an indirect evidence of development of the customers’ business. The Bank will pay considerable attention to diversification of the time resource base by means of development of relations with banks and international financial institutions.
In accordance with the Strategy of the Bank’s development 60-70% of the Bank’s assets will be used for corporate lending, small and business loans, and private loans. Expansion of the loan portfolio is ensured by means of development of long-term relations with existing Customers, and offers of maximum set of services to them. The main objective of CHELINDBANK in private lending market is retention and increase of its share by means of focusing at separate segments of retail lending market. Considerable efforts will be taken for promotion of lending services for employees of the companies that take part in the “salary projects”.
Quality, speed and technological efficiency of Customer service must become the final goal of organization of all business processes in the Bank, and ensure a 24 hour access of the Customers to information and banking services. Customers of the Bank will be able to receive services in any branch and subsidiary office of the Bank, no matter where they opened an account.
Main values for Customers are created by the Bank’s employees, that is why the Bank is continuously increasing their level of knowledge and loyalty. Main engines for development of the Bank are knowledge and skills of the staff which labor is remunerated depending on the contribution of each member of the team to achievement of the set goals.
The Bank will strengthen and develop existing competitive advantages, such as trust of the Customers, availability of banking services for a wide range of the Customers, high level of customer service, and promptness in making decisions.
In terms of relations with the shareholders the Bank is going to follow open informational policy and stick to the main principles of corporate governance. It is foreseen that the Bank will annually spend not less than 10% of the net profit for payment of dividends.
III. REPORT ON RESULTS OF DEVELOPMENT OF CHELINDBANK IN THE MAIN AREAS OF ITS PERFORMANCE
1. Financial results and capital
Assets of the Bank (according to published reports) increased by 17.6% during the year and comprised 23.1 bln rubles as of 01.01.2009, own capital of the Bank was equal to 3.5 bln rubles, capital adequacy ratio – 18.5% with the minimum possible level of 10%. Instant liquidity ratio of the Bank exceeded 38% with the minimum normative ratio of 15%, current liquidity – 78% with the minimum value of 50%.
There were significant changes in the structure of the Bank’s assets that is explained by revaluation of the fixed assets as of January 1, 2009. In accordance with the accounting Rules an appraisal company fulfilled revaluation of the fixed assets of the Bank. Recovery value totaled 3.3 bln rubles, fixed assets revaluation fund increased by 1.5 bln rubles. In the result of revaluation the fixed assets grew by almost 2 times, the gain was equal to 97.5%. The average share of the fixed assets in the assets of the Bank increased by 6% and reached 13.7%.
Assets and capital in dynamics (according to published reports)
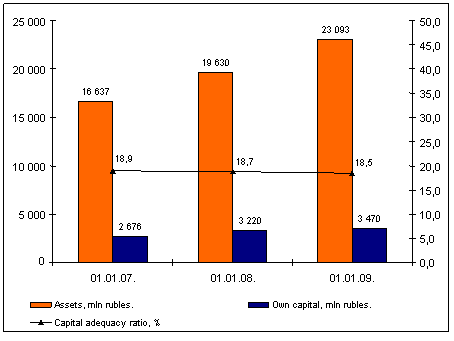

Pic. 4
Main area of the Bank’s active operations is lending. The net principal receivables increased by 21.2% during the year and reached 15.4 bln rubles, its average share in the assets of the Bank was equal to 66.6%. Customers’ loan portfolio of the Bank grew by 18.1% or 2.4 bln rubles during the year and totaled 15.5 bln rubles. The loans were mostly disbursed in rubles, the share of foreign currency loans is insignificant, it was equal to 4.4% of the loan portfolio of the Bank as of 01.01.2009. The gain of the loan portfolio was mainly caused by the growth of corporate principal receivable, its share in the gain totaled 51.0%, the loan portfolio increased by 41.7% because of the private loans, and by 7.3% - by means of the small business loans. The growth of the corporate loan portfolio happened mainly due to major large customers. Private loans have shown the fastest growth rates.
Table 3
Loan portfolio of the Bank by areas of lending
Type of lending | Loan portfolio, *****bles | Growth rate, % | Gain, thousand rub.. | Share in the gain, % | Share of the principal receivable in the loan portfolio for the area | ||
01.01.08 | 01.01.09 | 01.01.08 | 01.01.09 | ||||
Retail loans to private customers | 3 688 | 4 677 | 126,8 | 989 | 41,7 | 28,2 | 30,2 |
Small and medium business | 1 706 | 1 880 | 110,2 | 174 | 7,3 | 13,0 | 12,2 |
Corporate customers | 7 708 | 8 919 | 115,7 | 1 211 | 51,0 | 58,8 | 57,6 |
Loan portfolio - total | 13 102 | 15 476 | 118,1 | 2 374 | 100,0 | 100,0 | 100,0 |
The amount of the arrears comprised 548.9 mln rubles or 3.6% of the amount of the loan portfolio as of 01.01.2009. The highest rate of the arrears was for the corporate loans – 4.0%, retail loans – 3.1% and small business loans – 2.6%.
Table 4
Level of the arrears
Item | 01.01.2007 | 01.01.2008 | 01.01.2009 | Growth rate from 01.01.2008 to 01.01.2009, % |
Loan portfolio, *****bles | 11 | 13 | 15 | 118,1 |
Arrears, *****bles. | 97,2 | |||
Share of the arrears, % | 3,1% | 4,3% | 3,6% | - |
Comparison of provision level with the level of the arrears leads to a conclusion about adequate level of protection of portfolio and created provisions by the level of risks incurred by the Bank. At the same time, it should be mentioned that the level of provision will be getting higher in crisis environment.
Table 5
Level of the arrears and provision by lending areas
Area of lending | Level of provision, % | Level of arrears, % |
|
Loan portfolio, incl. | 8,2% | 3,6% |
|
| Corporate loans | 9,9% | 4,0% |
| Small and Medium Business Loans | 5,2% | 2,6% |
| Retail loans | 6,2% | 3,1% |
Net investments of the Bank to securities comprised 2.0 bln rubles or 9% of the Bank’s assets as of 01.01.2009. The securities portfolio of the Bank (in accordance with the balance sheet value) has the following structure: 68.5% are state bonds, 29.0% - bonds of other Russian issuers, and 2.5% - shares of big companies. In spite of the difficult situation in the securities market because of the world financial crisis the total income of the Bank in the field of securities operations was equal to 60 mln rubles for 2008.
Balance in the correspondent and deposit accounts in the correspondent banks comprised 1.6 bln rubles as of 01.01.2009, 1.2 bln rubles or 75% of this amount – balance of non-resident bank accounts. Wide correspondent network of the Bank allows dealing with the payment orders of the Customers for transactions to different countries.
The main average share of the Bank’s liabilities is the funds of the Customers – 93% or 16.9 bln rubles. More than 60% of the Customers’ funds are private deposits. The volume of the private deposits comprised 10.3 bln rubles as of January 1, 2009 including time deposits – 8.2 bln rubles. During 2008 time deposits with a term of more than 1 year increased by 12.6% and comprised 6.8 bln rubles. Thus, the main gain of the money funds in the accounts of private customers in the Bank has been reached due to increase of deposit volumes with maturity of 1 year and more, their share in the total volume of private funds totaled 65.8% as of 01.01.2009.
The funds received from enterprises and companies during this year increased by 13.9% and reached the level of 6.5 bln rubles including corporate deposits – 1.6 bln rubles. Deposit portfolio of the Bank increased by 40.5% during the year.
Customers’ funds in dynamics, mln rubles
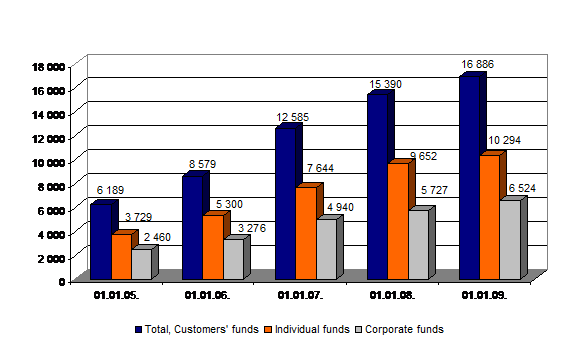
Pic. 5
Revaluation of the fixed assets as of 01.01.2009 led to considerable growth of the share of the own funds sources in the liabilities of the Bank – from 16.4 to 21.5%. The own funds of the bank in absolute value were equal to 5 *****bles. Correspondently, the share of the revaluated fixed assets increased in the structure of the own funds – from 32.9% as of the beginning of the year to 50.8% as of the end of the year.
The net income of the Bank in 2008 comprised 1.8 bln rubles that is 15.1% higher than the similar figure of 2007. The net interest incomes take the major place in the structure of the net incomes of the Bank and equal 61,5%. The gain rates of interest incomes in 2008 were more than 2 times higher than the gain rates of interest costs. The highest gain rates were demonstrated by the interest incomes received from Customers’ loans (non-credit institutions) – 129.4%. These incomes comprised 2.4 bln rubles or more than 90% in the total value of the interest incomes of the Bank. The amount of provisions for possible loan and interest income losses created in 2008 was 105% higher than the similar figure in 2007, that is why taking into account created provisions the net interest incomes increased by 17.4%. Additional creation of provisions for possible losses is explained by complicated financial situation in Russia due to the world crisis. In fact, provisions created by the Bank for possible losses comprised 1.4 bln rubles as of 01.01.2009 having increased by 38.1% during the year.
Table 6
Main figures of profit and loss account in dynamics
(*****bles)
Name of the article | Data for 2008 | Data for 2007 | Growth rate |
1 | 2 | 3 | 4 |
Interest incomes, total, including: | 2 | 2 | 123,0% |
Funds in the credit institutions | 52 977 | 69 649 | 76,1% |
Loans to non-credit institutions | 2 | 1 | 129,4% |
Investments into securities | 78,4% | ||
Interest costs, total, including: | 1 | 109,7% | |
Funds from credit institutions | 96 378 | 43 942 | 219,3% |
Deposits of non-credit institutions | 105,9% | ||
Issued debt bonds | 4 792 | 16 254 | 29,5% |
Change of provisions for possible losses for loans, principal and equal receivables, funds in the correspondent accounts and accrued interest incomes. | - | - | 201,3% |
Net interest incomes after creation of provision for possible losses | 1 | 117,4% | |
Net income from securities transactions | 5 149 | - | |
Net incomes from foreign currency transactions including revaluation | 55 772 | 38 057 | 146,5% |
Incomes from participation in the capital of other corporate entities | 1 913 | 0 | |
Net commission incomes | 104,5% | ||
Change of provisions for possible losses of securities and other losses | 122,4% | ||
Other operational incomes | 24 509 | 662,4% | |
Net incomes (costs) | 1 | 1 | 115,1% |
Operational costs | 1 | 1 | 117,9% |
Profit before taxation | 108,4% | ||
Accrued (paid) taxes | 103,7% | ||
Profit (loss) for accounting period | 111,8% |
The second significant part of incomes of the Bank is net commission incomes which comprised 35% of the net incomes of the Bank or 632 mln rubles. The decrease of the average share of commission incomes in 2008 in comparison with 2007 by 3.6% is caused by the change of method of calculation. Starting from 2008 commission incomes from opening of the loan accounts are included into interest incomes.

|
Из за большого объема этот материал размещен на нескольких страницах:
1 2 3 4 |
