

Партнерка на США и Канаду по недвижимости, выплаты в крипто
- 30% recurring commission
- Выплаты в USDT
- Вывод каждую неделю
- Комиссия до 5 лет за каждого referral
To undertake a retrospective and prospective analysis of the economic and labour market impact of population ageing, the simulation results are presented from 1982 to 2050 (see Table 2). Chart 9 also presents the impact of the demographic shock on real GDP per capita for Scenarios 1 and 2.
As indicated earlier, Scenario 1 assumes that time-allocation decisions are exogenous to the model. Therefore, changes in the return to work and to invest in human capital do not affect individuals’ labour supply and education decisions. According to the results of Scenario 1, following the massive labour supply shift during the 1970 and 1980s associated with the entry of the baby boom generation into the labour market, productive capacity increases substantially relative to the steady state with no population ageing. Real GDP per capita increases substantially during the 1980s, 1990s and 2000s. Eventually, as the baby boom generation gradually transits towards retirement, the impact on productive capacity stabilises and real GDP per capita begins to fall by 2014. Finally, between 2014 and 2050, real GDP per capita falls by about 10%, corresponding to a 0.4 percentage point annual growth reduction.
This result is similar to Fougère et al. (2005), Fougère and Mérette (2000b) and Hviding and Mérette (1998) who use OLG models and assume that labour supply and human capital investment decisions are exogenous. Baylor (2005) also comes up with similar results, although the OLG model he uses assumes endogenous labour supply but exogenous human capital investment decisions.
The demographic shock leads to a moderate increase in national savings during the 1980s and 1990s, and to a substantial reduction thereafter, as the baby boom generation transits towards retirement. The demographic shock also leads to capital deepening and to a substantial increase in real wages after 2002 to compensate for the relative scarcity of workers. Between 1982 and 2002, real wage changes are moderate.
When we turn to Scenario 2, the analysis indicates that young individuals with perfect foresight and rational expectations well anticipate the rise in the education premium in the future due to population ageing. As a result, they invest more in education at young age to supply more skilled labour at middle age. Consequently, by spending more time in education, the reduction in the labour supply of young adults initially lowers productive capacity. However, as future cohorts of middle-age workers are more skilled and work more, the productivity gains and additional supply of skilled workers eventually reduce the cost of ageing on productive capacity (see Chart 6). Consequently, the long term impact of population ageing is smoother over the period 1982 to 2050 and the cost in term of output loss appears more manageable. Between 2015 and 2050, real GDP per capita falls by about 4%, compared to 10% in Scenario 1.
Since the labour supply increase is more moderate initially in Scenario 2, the overall impact on national savings is more negative than in Scenario 1 until about 2038. Also, given that labour supply is endogenous in Scenario 2, the effect of population ageing on real wage pressures is smaller than in Scenario 1 since both wages and hours adjust (labour supply curve has a positive slope). In Scenario 1, labour market equilibrium comes exclusively from real wage changes (vertical supply curve).
Table 2
Impact of Population Ageing on Key Macroeconomic Indicators under Exogenous and Endogenous Time Allocation Decisions
Percent deviations with respect to initial steady state
1986 | 1990 | 1994 | 1998 | 2002 | 2006 | 2010 | 2014 | 2018 | 2022 | 2026 | 2030 | 2034 | 2038 | 2042 | 2046 | 2050 | |
Real GDP per capita | |||||||||||||||||
Scen1 | 1.1 | 2.4 | 3.8 | 5.1 | 6.0 | 6.5 | 6.8 | 6.9 | 6.8 | 6.4 | 5.7 | 4.7 | 3.4 | 1.7 | -0.1 | -2.1 | -4.0 |
Scen2 | 0.4 | 1.0 | 1.7 | 2.5 | 3.1 | 3.4 | 3.7 | 3.9 | 4.0 | 4.1 | 4.1 | 3.9 | 3.5 | 2.9 | 2.1 | 1.1 | 0.0 |
Capital-labour ratio | |||||||||||||||||
Scen 1 | -0.9 | -0.9 | 0.2 | 2.3 | 5.3 | 8.9 | 12.6 | 16.5 | 20.6 | 24.9 | 29.2 | 33.5 | 37.5 | 40.8 | 43.1 | 43.8 | 42.8 |
Scen 2 | -0.6 | -0.7 | -0.2 | 0.9 | 2.5 | 4.4 | 6.4 | 8.4 | 10.5 | 12.8 | 15.1 | 17.3 | 19.5 | 21.3 | 22.7 | 23.5 | 23.3 |
National savings rate | |||||||||||||||||
Scen1 | 0.6 | 1.0 | 1.4 | 1.5 | 1.3 | 0.6 | 0.0 | -0.9 | -1.7 | -2.7 | -3.7 | -4.8 | -6.0 | -7.1 | -8.3 | -9.3 | -10.2 |
Scen2 | 0.3 | 0.5 | 0.6 | 0.6 | 0.3 | -0.5 | -1.2 | -2.0 | -2.8 | -3.7 | -4.6 | -5.4 | -6.3 | -7.1 | -7.9 | -8.6 | -9.2 |
Labour supply* | |||||||||||||||||
Scen1 | 4.6 | 9.1 | 13.2 | 16.7 | 19.2 | 20.7 | 20.9 | 19.8 | 17.3 | 13.5 | 8.7 | 3.1 | -2.8 | -8.9 | -14.7 | -20.2 | -25.1 |
Scen2 | 4.0 | 7.9 | 11.5 | 14.6 | 16.9 | 18.5 | 18.9 | 18.2 | 16.2 | 13.1 | 9.1 | 4.3 | -0.8 | -6.2 | -11.5 | -16.6 | -21.4 |
Effective labour supply* | |||||||||||||||||
Scen1 | 5.3 | 10.5 | 15.4 | 19.5 | 22.7 | 24.6 | 25.3 | 24.5 | 22.3 | 18.7 | 13.8 | 8.0 | 1.5 | -5.3 | -12.0 | -18.4 | -24.1 |
Scen2 | 4.5 | 8.9 | 13.2 | 17.1 | 20.2 | 22.5 | 23.7 | 23.7 | 22.3 | 19.8 | 16.0 | 11.3 | 5.9 | 0.1 | -5.9 | -11.8 | -17.3 |
Real wage rate | |||||||||||||||||
Scen1 | -0.3 | -0.3 | 0.0 | 0.7 | 1.6 | 2.6 | 3.6 | 4.7 | 5.8 | 6.9 | 8.0 | 9.0 | 10.0 | 10.8 | 11.3 | 11.5 | 11.3 |
Scen2 | -0.2 | -0.2 | -0.1 | 0.3 | 0.7 | 1.3 | 1.9 | 2.4 | 3.0 | 3.6 | 4.3 | 4.9 | 5.5 | 6.0 | 6.3 | 6.5 | 6.5 |
*Labour supply accounts for changes in total hours worked, while effective labour supply also includes a measure of quality in the workforce.
Chart 6
Impact of Population Ageing on Real GDP per Capita
Endogenous vs. Exogenous Time Allocation Decision Scenarios
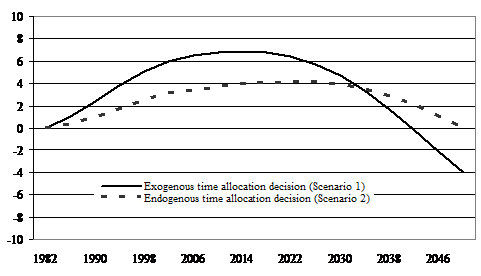
Chart 7 provides an overview of the dynamic change in labour supply behaviour by cohort during the working life. For illustrative purposes, we examine 5 cohorts who enter the labour market in 1974, 1986, 1998, 2010 and 2018, respectively. As can be shown, for cohort 1974, time allocated to work rises steadily from age 17-20 to 25-28, stabilises between 25-28 and 45-48 and declines more rapidly during pre-retirement years as the preference for leisure rises. However, for future cohorts, the labour supply behaviour changes gradually, with a substantial reduction in time allocated to work for age 17-20 to 37-40, which is mainly compensated by an increase in time allocated to education. At middle age (41-44), the labour supply increases and time allocated to work becomes greater than that of previous cohorts. Also, since these individuals have invested more time in human capital, they are more qualified and productive. Finally, as they get older, they work longer than previous cohorts. For example, for age groups 57-60, 61-64 and 65-68, time allocated to work increases by 14%, 23.5% and 46.7%, respectively between cohort 1974 and cohort 2018.
Chart 7
Impact of Population Ageing on Time Allocated to Work by Cohort
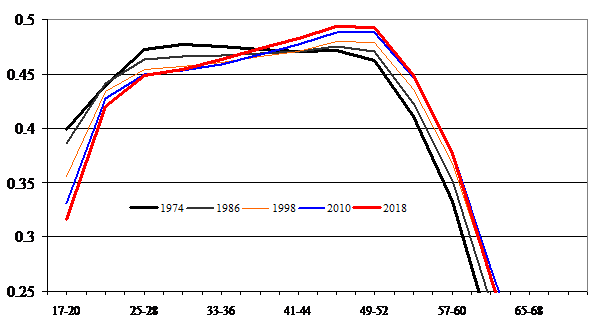
Chart 8 presents the evolution of time allocated to education between 1978 and 2050 for age groups 17-20 and 21-24. Time allocated to education for age group 17-20 more likely corresponds to college and undergraduate university education, while time allocated to education for age group 21-24 captures a greater proportion of post-graduates (Master’s degrees and Doctorates). As can be shown, the model indicates that population ageing provides more incentives to invest in education for age group 17-20, beginning in the early-1980s, as time spent in education increases, while time spent in education for age group 21-24 remains unchanged over history. This result generated by the model is consistent with the stylised facts (see Chart 4).
Chart 8
Time allocated to Education for Age Groups 17-20 and 21-24
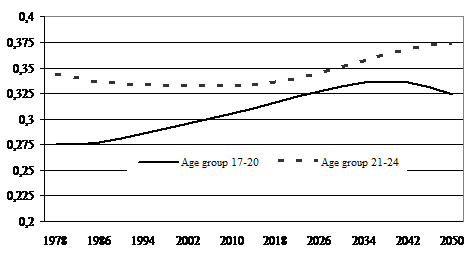
The model also indicates that time allocated to education increases for age group 17-20 over the period and declines thereafter. In comparison, time allocated to education for age group 21-24 remains unchanged until 2010 and then increases during the period.
8. Conclusion and Policy Implications
This study explores the long-term impact of population ageing on labour supply and human capital investment in Canada. More specifically, the study examines to what extent the demographic shock observed since the 1960s and 1970s could explain the behaviour on labour supply and human capital investment during the 1980s and 1990s. It also evaluates the long-term impact of more educated cohorts of workers on productive capacity. The analysis is conducted with a dynamic CGE overlapping generations model.
The results first provide a possible explanation to the significant rise in the level of education over the past 25 years. Beginning in the 1980s and 1990s, population ageing created opportunities for young individuals with rational expectations to invest more in education at young age and supply more skilled labour later at middle age.
Second, by spending more time in education, the reduction in labour supply of young adults initially lowers productive capacity and exacerbates the economic costs of population ageing. According to the model, we are currently bearing the cost of population ageing through lower labour supply from young adults. However, current and future cohorts of middle-age workers are more skilled and work more, which eventually will raise productive capacity and significantly lower the economic cost of population ageing.
Third, over the past few years, we have observed a significant increase in the participation rate of older workers. Some may argue that the effect is temporary and reflects the recent reduction in stock market performance on the retirement behaviour.[8] The results from this paper suggest instead that the recent increase in the participation rate of older workers might be the beginning of a new trend from more educated workers that will amplify over the next few decades.
Finally, as indicated earlier, agents are assumed to be rational in the model and to well anticipate the consequences of population ageing. This implies that their time allocation is always optimal. However, if young individuals are myopic, they would rather expect future earnings to equal the earnings of current older workers. Young individuals would then underestimate the returns to invest in human capital and enter into the labour market earlier instead of spending more time in school. This implies that governments have an important role to play to ensure that current young and future cohorts have complete information before they make a choice between higher education and the job market. If they make the right choice, the economic cost of population ageing will be quite manageable. If not, the cost will be much greater and lead to much slower growth in living standards for future generations.
References
Altig, David, Alan Auerbach, Larry Kotlikoff, Ken Smetters and Jan Walliser (1997), “Simulating U. S. Tax Reform”, NBER Working Paper no. 6246.
Auerbach, Alan J., Laurence J. Kotlikoff, Robert P. Hagemann and Giuseppe Nicoletti (1989), “The Economic Dynamics of an Ageing Population: The Case of Four OECD Countries”, OECD Economic Review, no. 12, pp. 97-130.
Auerbach, Alan J., and Kotlikoff, Laurence J. (1987), Dynamic Fiscal Policy (Cambridge, UK: Cambridge University Press).
Barro, R. J. (2001), “Education and Economic Growth”, In Helliwell, J. F. ed., The Contribution of Human Capital and Social Capital to Sustained Economic Growth and Well-Being, OECD, Chapter 3, pp. 14-41
Barro, R. and X. Sala-i-Martin (1992), “Convergence”, Journal of Political Economy, Vol. 100, pp. 223-251.
Barro, R. J. and J. W. Lee (1996), “International Measures of Schooling Years and Schooling Quality”, American Economic Review, Vol. 86, Vol. 2, pp. 218-223.
Bassanini, Andrea and Stefano Scarpeta (2001), “The Driving Forces of Economic Growth: Panel Data Evidence for the OECD Countries”, OECD Economic Studies, No. 33, II, pp. 9-56.
Baylor, Maximilien (2005), Government Debt, Taxation, and the Economic Dynamics of Population Ageing, Mimeo, Paper presented at the Annual Meeting of the CEA, Hamilton, May.
Becker, Gary (1965), “A Theory of the Allocation of Time”, The Economic Journal, Vol. 75, pp. 493-517.
Boersch-Supan, Axel, Alexander Ludwig and Joachim Winter (2002), “Aging and International Capital Flows”, in A. Auerbach and H. Hermann (eds.), Aging, Financial Markets and Monetary Policy, Heidelberg: Springer, pp. 55-83.
Coile, Courtney C. and Phillip B. Levine (2004), Bulls, Bears and Retirement Behavior, NBER Working Paper no. 10779, Cambridge.
Coulombe, Serge, Jean-François Tremblay and Sylvie Marchand (2004), Literacy Scores, Human Capital and Growth Across OECD Countries, Statistics Canada, Catalogue no. 89-552-MIE.
Équipe Ingénue (2001), Macroeconomic Consequences of Pension Reforms in Europe: An Investigation with the Ingenue World Model, CEPII working paper no. 17
de la Fuente, Angel and Rafael Doménech (2000), Human Capital in Growth Regressions: How Much Difference Does Data Quality Make?, CEPR discussion paper, no. 2466, May
Fehr, Jokisch and Kotlikoff, Laurence (2004), The Role of Immigration in Dealing with Developed World’s Demographic Transition, NBER, working paper no. W10512
Fougère, Maxime, Simon Harvey, Jean Mercenier and Marcel Mérette (2005), Population Ageing, High-Skilled Immigrants and Productivity, Working Paper 2005 A-07, HRSDC-IC-SSHRC Skills Research Initiative.
Fougère, Maxime and Mérette Marcel (2000a), “Population Aging, Intergenerational Equity and Growth: An Analysis with an Endogenous Growth Overlapping Generations Model”, In Using Dynamic General Equilibrium Models for Policy Analysis, eds. G. Harrison, Svend E. Hougaard Jensen, Lars Haagen Pedersen and Thomas Rutherford, Amsterdam: North Holland.
Fougère, Maxime and Mérette Marcel (2000b), “Economic Dynamics of Population Ageing in Canada: An Analysis with a Computable Overlapping Generations Model”, Mimeo, Department of Finance, Ottawa.
Fougère, Maxime and Mérette Marcel (1999), “Population Ageing and Economic Growth in Seven OECD Countries”, Economic Modelling, Vol. 16, pp. 411-427
Freige-Seren, Maria Jesus (2001), “Human Capital Accumulation and Economic Growth”, Investigaciones Economicas, Vol. 25, no. 3, pp. 585-602.
Group of Ten (1998), The Macroeconomic and Fiscal Implications of Ageing Populations, Basle: Bank of International Settlements.
Hanushek, E. A. and D. D. Kimko (2000), “Schooling, Labor force Quality and the Growth of Nations”, American Economic Review, Vol. 90, No. 5, pp.
Heckman, J. (1976), “A Life-Cycle Model of Earnings, Learning and Consumption”, The Quarterly Journal of Economics, Vol. 84, pp. 511-544
Hviding, Ketil and Marcel Mérette (1998), Macroeconomic Effects of Pension Reform in the Context of Ageing : OLG Simulations for Seven OECD Countries, Working Paper no. 201, OECD, 1998.
Islam, N. (1995), “Growth Empirics: a Panel Data Approach”, Quarterly Journal of Economics, Vol. 110, pp. 1127-70
Kotlikoff, Laurence, Kent Smetters and Jan Walliser (1999), “Privatizing Social Security: A Simulation Study”, in: Klaus Schmidt Hebbel (ed.), Pension System: From Crisis to Reform, Washington D. C.: The World Bank.
Laroche, Mireille and Marcel Mérette (2000), Measuring Human Capital in Canada, Department of Finance Working Paper no. 2000-05, Ottawa.
Laroche, Mireille, Marcel Mérette and Yu Lan (2005), Measuring and Projecting Human Capital for Men and Women, SRI Working Paper forthcoming.
Laroche, Gabriel (2000), L’approche par profession de l’emploi hautement qualifié, CETECH.
Lucas, R. E. (1988), “On the Mechanics of Economic Development”, Journal of Monetary Economics, Vol. 22, pp. 3-42
Lucas, R. E. (1990), “Supply-Side Economics: an Analytical Review”, Oxford Economic Papers, Vol. 42, pp. 293-326
Mankiw, N. G., D. Romer and D. N Weil (1992), “A Contribution to the Empirics of Economic Growth”, Quarterly Journal of Economics, Vol. 107, no. 2, pp. 407-437
Nehru, V., E. Swanson and A. Dubey (1995), “A New Database on Human Capital Stocks in Developing and Industrial Countries: Sources, Methodology and Results”, Journal of Development Economics, Vol. 46, pp. 379-401
OECD (2000), Knowledge Management in the learning society, Paris.
Romer, Paul (1989), “Human Capital and Growth: Theory and Evidence”, NBER Working Paper no. 3173.
Sadahiro, Akira and Manabu Shimasawa (2003), “The Computable Overlapping Generations Model with an Endogenous Growth Mechanism”, Economic Modelling, Vol. 20, no. 1, pp. 1-24.
[1] For example, Fougère et al. (2005) find that without policy changes, population ageing could lead to an average growth reduction of 0.4 percentage points in real GDP per capita over the period .
[2] See, for example Borsch-Supan et al. (2002), Équipe Ingenue (2001), Hviding and Mérette (1998) and Auerbach et al. (1989) for international studies. Alternatively, Ferh et al. (2004) argue that population ageing will lead to a reduction in the capital-labour ratio.
[3] Although, Fougère and Mérette (1999, 2000a) and Sadahiro and Shimasawa (2003) look at the relationship between population ageing and human capital in a Lucas-type endogenous growth model, they assume that leisure time remains exogenous. Moreover, they do not relax the endogenous growth assumption to test the robustness of their results under a Mankiw, Romer and Weil (1992) framework.
[4] See Models of economic-demographic system (MEDS), Research Institute for Quantitative Studies in Economics.
[5] See, for example, Lucas (1988), Romer (1989) and Mankiw, Romer and Weil (1992).
[6] These studies are Ciccone and Peri (2005), Krusell et al. (2000), Caselli and Coleman (2000) and Katz and Murphy (1992).
[7] Heckman et al. (1998) have estimated the value of γ and ψ to sum to 1.8.
[8] It must be noted that Coile and Levine (2004) find no evidence for the U. S. that changes in the stock market drive aggregate trends in labour supply for older workers.

|
Из за большого объема этот материал размещен на нескольких страницах:
1 2 |
