

Партнерка на США и Канаду по недвижимости, выплаты в крипто
- 30% recurring commission
- Выплаты в USDT
- Вывод каждую неделю
- Комиссия до 5 лет за каждого referral
Population Ageing, Time allocation and Human Capital: a General Equilibrium Analysis for Canada*
Maxime Fougère Simon Harvey
Policy Research and Coordination Policy Research and Coordination
Human Resources and Skills Development Canada Human Resources and Skills Development Canada
Gatineau, Qc, K1A 0J9 Gatineau, Qc, K1A 0J9
Maxime. *****@***gc. ca Simon. *****@***gc. ca
Jean Mercenier Marcel Mérette
Département de science économique Department of Economics
et THEMA University of Ottawa
Université Cergy-Pontoise Ottawa, Ont, K1N 6N5
Paris, France *****@***ca
Jean. *****@***u-cergy. fr
Summary
This study explores the long-term impact of population ageing on labour supply and human capital investment in Canada, as well as the induced effects on productive capacity. The analysis is conducted with a dynamic computable overlapping generations model where in the spirit of Becker (1965) and Heckman (1976), leisure has a quality-time feature and labour supply and human capital investment decisions are endogenous. The role of human capital in the growth process is based on the framework used by Mankiw, Romer and Weil (1992). The paper indicates that population ageing creates more opportunities for young individuals to invest in human capital and supply more skilled labour at middle age. Consequently, the reduction in labour supply of young adults initially lowers productive capacity and exacerbates the economic costs of population ageing. However, current and future middle-age cohorts are more skilled and work more, which eventually raises productive capacity and significantly lowers the cost of population ageing. Finally, these results suggest that the recent increase in the participation rate of older workers might be the beginning of a new trend that will amplify over the next decades.
Key words: Ageing, overlapping generations model, time allocation, human capital, labour supply
JEL classification: D58, J22, J24
*This project was undertaken under the Skills Research Initiative, a research partnership between Human Resources and Skills Development Canada (HRSDC), Industry Canada (IC) and the Social Science and Humanities Research Council (SSHRC). The views expressed in this document are solely those of the authors and do not necessarily reflect the views of HRSDC, IC or SSHRC. The authors thank the participants of 12th International Conference on Computing in Economics and Finance (CEF 2006) for their valuable comments.
1. Introduction
With the decline in the fertility rate, increase in life-expectancy and ageing of the baby boom generation, the growth in labour force population is slowing in Canada and most OECD countries. According to recent demographic projections and despite immigration, the Canadian elderly dependency ratio (ratio of population 65+ as a proportion of the 15-64 population) is expected to at least double between 2000 and 2050. From one individual aged 65+ for five worker-age individuals in 2000, this ratio will rise to 2/5 in 2050.
The slowing in labour force growth being inevitable, the long-term consequences on growth in productive capacity could be substantial if it is not compensated by a significant rise in productivity.[1] The increase in relative scarcity of labour caused by population ageing could also lead to a reduction in national savings, an increase in physical capital intensity, an increase in real wages and a reduction in world interest rates.[2] However, most studies so far have ignored the effect of population ageing on time allocation, more specifically on time spent at work and in human capital formation.[3] This paper argues that since population ageing is expected to lead to significant changes in production factor returns, these effects and their potential impact on productive capacity could be important.
Several factors can be considered to compensate for the decline in labour force growth. First, since the return to human capital is the discounted sum of future wage revenues, future young cohorts might be inclined to invest more in education. Second, a greater participation of middle-age and older workers may arise as a consequence of the increase in real wage pressures. Third, current cohorts of young adults are better educated than older cohorts (young women in particular). These combined factors would lead to a rise in the quality of the workforce, in productivity and to an increase in hours worked.
This paper uses a dynamic applied general equilibrium model with overlapping generations and endogenous time-allocation decisions to explore the relationship between population ageing, human capital and labour supply. Two simulation experiments are undertaken. The first simulation performed examines the long-term economic and labour market impact of population ageing in Canada by assuming that time-allocation decisions are exogenous. The second simulation applies the same demographic shock, but this time with endogenous time-allocation decisions.
The difference between the two scenarios will isolate the contribution of endogenous labour supply and human capital investment decisions on productive capacity in the context of demographic changes. More specifically, the second simulation will explore to what extent the demographic shock observed since the 1960s and 1970s could explain the stylised facts on labour supply and human capital investment by cohort during the 1980s and 1990s and evaluate the long-term impact of more educated cohorts of workers on productive capacity.
The paper is structured as follow. Section 2 provides a few stylised facts on historical and projected future demographic changes. Section 3 presents an overview on the relationship between human capital and growth. Section 4 discusses the possible relationship between population ageing and human capital. Section 5 describes the technical structure of the model used for the analysis and Section 6 the calibration procedure. Section 7 presents the main simulation results. Finally, Section 8 raises some policy implications and concludes.
2. Some Stylised Facts on Canada’s Demographic Changes
As indicated in introduction, over the next decades, population and labour force growth are expected to slow significantly. In addition, the age-composition of the population will change substantially. This section presents an overview of historical and projected demographic changes, according to HRSDC demographic projections using MEDS.[4]
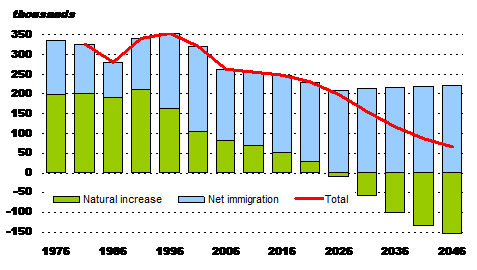
Chart 1 presents historical and projected population growth in Canada. As can be shown, over the period 1976 to 2000, the annual population increase has averaged about 325 thousands. Until 1991, the natural increase in the population accounted for about 2/3 of the population increase, the rest coming from net immigration. Over the past ten years, although the population increase has remained constant, the substantial reduction in the fertility rate led to a reduction in the natural increase of the population, which was compensated by an increase in the composition of immigration in population growth. According to a recent demographic projection, the natural increase in the population will continue to slow and eventually turn 2026, the net population increase will essentially come from immigration.
Chart 1
Historical and Projected Population Growth in Canada
Source: Statistics Canada, Census ; HRSDC-PRCD, (COPS Reference 2004)
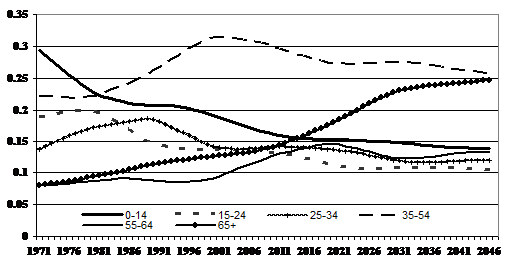
The age-composition of the population is also expected to change substantially over the next decades. As shown in Chart 2, the proportion of the younger population (0-14) is expected to continue to fall over the next decades from 18.9% in 2001 to 13.8% in 2046, while the proportion in age group 15-24 will fall more moderately from 13.6% to 10.4% over the same period, after a more significant decline since the early 1980s. In comparison, the proportion of the prime-age population (25-34) will decline at an even more moderate pace, from 13.9% to 12% over the period 2001 to 2046. In contrast, the proportion of the middle-age population (35-54) has increased substantially over the past two decades, which illustrates the effect of the demographic shock from the baby boom generation on the population structure. According to the demographic projection, the proportion of the middle-age population is beginning to decline. From the 31.5% peak in 2001, the proportion of this age group will fall to 25.7% of the population in 2046.
Following the effect of the baby boom cohorts, the proportion of the 55-64 age group is projected to increase from 9.4% in 2001 to 14.5% in 2020. This will be followed by a moderate decline in the longer term to 13.3% by 2046. Finally, to illustrate the demographics of population ageing, the older age group (65+) is expected to increase at a rapid pace during the next 25 years, from 12.6% in 2001 to 22.7% in 2030, then grow more moderately between 2030 and 2046 and reach 24.7% by 2046.
Chart 2
Population Share by Age Group in Canada
|
Source: Statistics Canada, ; HRSDC-PRCD, (COPS Reference 2004)
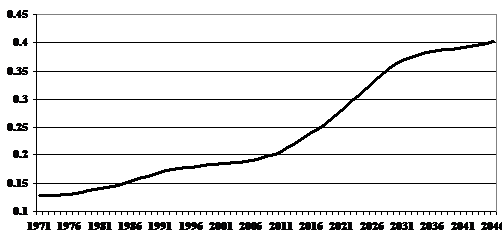
Chart 3 now presents the historical and projected old-age dependency ratio (population 65+ as a ratio of the population 15-64). As can be seen from the chart, over the period 1971 to 2001, the old-age dependency ratio increased from 0.13 to 0.185. Over the next decades, it is expected to continue rising, first at an increasing rate, until about 2031, and at a slower pace for the remaining projection period. Between 2001 and 2046, this represents a 216% increase in the old-age dependency ratio.
Chart 3
Projected Elderly Dependency Ratio in Canada
|
Source: Statistics Canada, ; HRSDC-PRCD, (COPS Reference 2006)
3. The Role of Human Capital in Economic Growth
The role of human capital formation in the growth process has been extensively analysed in the literature.[5] According to the theoretical literature, human capital would affect economic growth in two ways. First, human capital directly participates in production as a productive factor and the accumulation of capital directly generates output growth. This is the so-called level effect. Second, human capital can contribute to raising technical progress through increased innovation, diffusion and adoption of new technologies. From this indirect channel, human capital influences growth through increases in productivity.
The level effect of human capital on economic growth has been examined through the convergence analysis as proposed by Barro and Sala-i-Martin (1992). In their influencial paper, Mankiw, Romer and Weil (1992) (henceforth MRW) extend the basic Solow model of economic growth by accounting for the accumulation of human capital to better explain cross-country differences in living running simple cross-country regressions, they find evidence of a direct effect of human capital on economic growth.
Following MRW, several papers have examined the relation between human capital and growth by modifying some aspects of the analysis. Overall the empirical literature has come up with mixed results. For example, Islam (1995), Hanushek and Kimko (2000) and Barro (2001) either find a negative or insignificant relationship between human capital and growth. Among the studies that find a significant positive relationship between human capital and growth, Fuente and Doménech (2000) argue that poor data quality may explain the mitigated results found in the improving the data quality from Barro and Lee (1996) and Nehru et al. (1995), they find positive, more robust and theoretically plausible results using a variety of growth specifications. Bassanini and Scarpeta (2001) also provide evidence that investment in human capital has been an important engine of growth in Canada and most OECD countries over the past decades. Freige-Seren (2001) uses a dynamic system that describes the behaviour of the economy to examine how human capital affects growth, by considering the simultaneity or reverse impact of growth on human capital accumulation. He provides evidence about the level effect of education on economic growth. Finally, Coulombe et al. (2004) find a strong empirical relationship between human capital and economic growth across OECD countries by using a measure of human capital based on literacy scores.
4. Population Ageing and the Accumulation of Human Capital
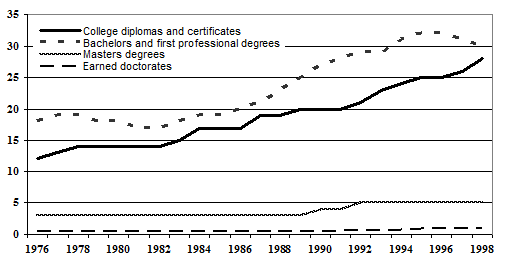
It is well know that the education component of human capital has grown substantially in Canada over the past decades. For example, the percentage of the population aged 25-29 with post-secondary education has risen from 43.8% in 1990 to 62.8% in 2003 (source: Labour Force Survey). When we decompose graduation rates by education level (see Chart 4), we can see that graduation rates for bachelors, college diplomas and certificates have increased almost steadily over the past two decades, while graduation rates for masters and doctorates has remained flat throughout the period, except for an increase in masters degree during the period.
However, with population ageing, the contribution of human capital to growth is uncertain in the future. On the one hand, as the baby boom generation ages, the older workforce is expected to raise the experience component of human capital. On the other hand, the net contribution of education to the growth in human capital is indeterminate because key determining factors may play in opposite directions. First, the younger population will continue to represent a smaller proportion of the workforce, which may reduce the contribution of education to human capital. Second, the increase in relative scarcity of workers may raise real wages and the return to human capital. Third, the rise in the stock of human capital associated to experience may flatten the lifecycle earnings profile, and hence reduce the net return to education.
Chart 4
Graduation Rates
(Relative to Population at Typical Graduation Age)
Source: University Student Information System, Statistics Canada
A number of studies have recently looked at the contribution of human capital to growth in the context of an ageing population. Fougère and Mérette (1999, 2000a) (henceforth FM99 and FM00) provide simulation results with an overlapping generations endogenous growth model, where growth is generated by the accumulation of physical and human capital. FM99 examine seven OECD countries and FM00 use a more detailed model for Canada. Their results indicate that population ageing could create more opportunities for future generations to invest in human capital, which in turn would stimulate economic growth and significantly reduce the negative apprehended reduction in real GDP per capita.
Using a model structure of endogenous growth similar to FM99, Sadahiro and Shimasawa (2003) examine the long-term consequences of population ageing in Japan. Among their key findings, they find that younger individuals have a greater incentive to allocate their time into education in the phase of declining population growth and that the endogenously determined growth in human capital offsets the negative labour force growth rate on economic growth.
Building on previous work from Laroche and Mérette (2000), Laroche, Mérette and Lan (2005) present an updated measure of Canada’s human capital stock for the period 1971 to 2000, which accounts for completion of education levels and years of working experience. They also provide a projection until 2041, accounting for changes in demographics and on alternative assumptions about the return to education in the future. Under the assumption that the rate of return to education and experience remains at its 2001 level, their results indicate that human capital will grow at a slower pace in the future, compared to the last decades. Under the alternative assumption that the positive trend in the rate of return to education and experience observed during the period continues, human capital grows at a faster rate than during the past 30 years.
5. The Model
The analysis is based on a dynamic general equilibrium model with an overlapping generations (OLG) structure. The model is calibrated to represent the Canadian economy. This section provides a technical description of the model.
5.1 The production sector
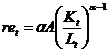
A representative firm produces a unique good. Its production technology is represented by a Cobb-Douglas production function. The national firm hires labour and rents physical capital up to their marginal products. With Yt representing output at time t, Kt the capital stock, Lt the effective labour force, and A the scaling variable, we have:
(1) 
where  is the share of capital in value added. Firms are assumed perfectly competitive and factor demands follow from profit maximization:
(2) 
(3) 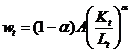
where is the rental rate of capital and  the wage rate per unit of effective labour.
5.2 Investment and Asset Returns
The accumulation of the capital stock ( Kt ) is determined by the following equation:
(4)  ,
,
where Invt represents investment made at time t and δ is the depreciation rate of capital. The rate of return on capital  is a function of its rental rate
 minus the depreciation rate:
(5) 
As explained in detail below, bonds issue by the government and capital shares are perfect substitutes. Consequently expected return on capital also equals returns on bonds:
(6) 
where rit is the rate of return on bonds issued at time t.
5.3 Household Behaviour
The population is represented by 15 representative Canadian households structured in an Allais-Samuelson overlapping generations structure. Consequently, at each period of time, 15 generations live side by side. At any period t, a new generation is born and the eldest dies. Each native-born individual enters the labour market at the age of 17 and dies at the age of 76. This implies that each period of the model corresponds to 4 years. Younger individuals are assumed to be dependent on their parents, implying that they play no active role in the model. The population growth rate and immigration are exogenous.
Individuals optimise a CES type inter-temporal utility function of consumption and time allocation subject to lifetime income and time constraint. The household’s optimisation problem consists of choosing the consumption and savings pattern over the lifecycle, as well as the time allocation between working, education and leisure. Time spent in education correspond to human capital investment. Human capital gains also raise effective labour supply and the quality of leisure. The inter-temporal utility function takes the following form:
(7)  ,
,
 and
and  are respectively consumption and leisure activity of an individual of age group g at time t ; ρ the pure rate of time preference; σ the inverse of the inter-temporal elasticity of substitution; θ the inverse of the intra-temporal elasticity of substitution between consumption and leisure activity; and øg the leisure activity preference parameter. The specification of leisure follows pioneer work of Becker (1965) and Heckman (1976). Leisure activity takes a quality time specification as it is the product of the fraction of time allocated to it times the stock of human capital accumulated. Leisure activity takes a linear form:
  , where l is leisure time and h the stock of human capital accumulated by an individual at age g and time t.
The human capital technology is described by a well-behaved technology, linear in h, but strictly concave with respect to educational and training time. Human capital production is individualized, and total production of new human capital in the economy is simply the sum of all generations’ production. The specification chosen is similar to that in Lucas (1988, 1990). The technology for the production of human capital takes the following form:
(8)  , β > 0, 0 < γ < 1, δ > 0,
where z is the fraction of time allocated to the production of human capital, δ the human capital depreciation rate, γ the elasticity of human capital production, β a production parameter and Exp an experience variable that exogenously evolves with age. Each household is endowed with one unit of time for each period of life. As time can be allocated to leisure activity and the production of human capital, what is left for labour market participation (Lpar) is:
(9) 
The representative adult optimises equation (7) subject to (8), (9) and to a budget constraint. The representative adult budget constraint in each period of his life is:
(10) 
where ag, t represents the assets accumulated at age g and time t, crt the public pension contribution rate and τw, τk and τc, the effective tax rates on labour income, capital income and consumption expenditures. Government transfers are represented by Tr, OAS, GIS and Pens. Tr represents government transfers excluding public pensions, OAS is Old Age Security, GIS includes Guaranteed Income Supplement and Spouse's Allowance (SPA). Pens is Canada and Quebec Pension Plans’ (CPP/QPP) benefits. CPP/QPP benefits are a fraction of lifetime labour earnings, which is determined by the pension replacement rate PensR.
(11) 
5.4 The Government Sector
The national government issues bonds to finance the public debt and to satisfy the budget constraint. It taxes labour income and taxable transfers, capital income and consumption expenditures. It spends on public expenditures, health care, education and interest payments on the regional government public debt. It also provides transfers to residents through the presence of social transfers.
The government budget constraint is defined as:
(12) 
On the left hand side of the above equation, Bondt is the stock of debt accumulated by the government at time t and  is the government deficit. The three remaining expressions on the left-hand side are government revenues from taxes levied on labour income (plus taxable transfers), consumption and capital income. On the right-hand side of the equation, Govt is public expenditures. The remaining expressions include total transfer payments (Tr, OAS and GIS), which evolve with demographic changes, and interest payments on the public debt.
CPP/QPP pension plans are represented by the following equation:
(13) 
The left-hand side is pension benefits to be paid and the right-hand side is workers’ contributions.
5.5 Market and Aggregation Conditions
The model assumes perfectly competitive markets and perfect foresight agents. The equilibrium condition for markets of goods states that total output must be equal to total demand:
(14)  .
.
The stock of effective labour supplied is the number of workers times their corresponding human capital stock and labour force participation rate:
(15) 
Bonds and physical capital ownerships are considered perfectly substitutes. Hence total supply of assets must equal total demand:
(16) 
6. Calibration Procedure and Parameters
Since the simulation results depend greatly on the parameter values of the behavioural functions, the calibration procedure is an important and delicate task. The CGE model must first generate an initial equilibrium in a dynamic framework, to replicate the stylised facts present in the data. The initial equilibrium is in fact a steady state that repeats every period with a population structure assumed to remain unchanged. A demographic shift is then imposed to the steady state to capture the composition of the population in 2002 and the demographic projection up to 2046. Since the population composition of 2002 is the result of changes in the birth rate and life expectancy that occurred in the past, it is necessary to begin the demographic shock in 1946. Changes in the birth rate are used to replicate the old-age dependency ratio observed and projected up to 2046. After 2046, we assume that the birth rate gradually returns to its natural replacement level.
6.1 Time Allocation
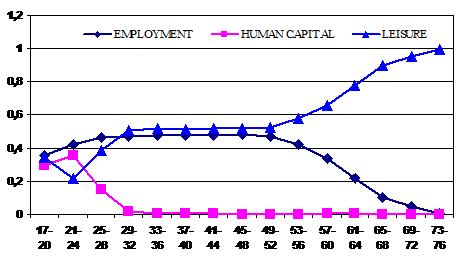
Chart 5 presents the distribution of time allocation by age group in the initial steady state. Data on time allocated to employment is derived from HRSDC-PRCD labour force participation rate model, while time allocated to human capital is derived from the 1998 General Social Survey on Time Use.
As shown in Chart 5, when young, individuals allocate a significant proportion of their time to college and university education. Time allocated to education peaks at age 21-24 to account for time spent in undergraduate and some graduate university education. This is mainly at the expense of lower leisure time. Time allocated to education falls at age 25-28, accounting for individuals who undertake Master’s and Doctorate degrees and tends to zero thereafter. It can also be seen that although workers may spend some of their time in adult training, in aggregate time spent in training during a year remains negligible. Time spent in employment gradually increases when young and stabilises at age group 29-32 until 49-52. After 49-52, the preference for leisure increases, working time decreases and eventually turns to zero.
Chart 5
Time Allocation in the Initial Steady State
6.2 Behavioural Parameters
Table 1 reports key behavioural and government program parameter values. The value of the inter-temporal elasticity of substitution is 0.25 and the value of the intra-temporal elasticity of substitution between consumption and leisure is 0.8. These values are similar to those used by Altig et al. (1997), Kotlikoff et al. (1999) and Baylor (2005). The CPP/QPP pension replacement rate is 0.2. The elasticity of substitution for labour demand across qualification is set to 1.5. This is based on a survey of recent studies who estimated long-run elasticity of substitution between more educated and less educated workers.[6] The elasticity of human capital technology is equal to 1.7 (ψ + γ) and is taken from Fougère and Mérette (1999, 2000) and Heckman et al. (1998).[7]
Table 1
Behavioural and Government Program Parameters
Symbol | Value | |
Inter-temporal elasticity of substitution | 1/σ | 0.25 |
Intra-temporal elasticity of substitution | 1/ θ | 0.8 |
Ratio of CPP/QPP pension replacement rate | cr | 0.2 |
Elasticity of time allocated to the production of human capital | γ | 0.7 |
Elast. of human capital already acquired to the production of human capital | ψ | 1.0 |
Elasticity of substitution for labour demand across qualification | σL | 1.5 |
Production share of physical capital | α | 0.3 |
Rate of interest | ri | 0.38 |
Depreciation rate of physical capital | δ | 0.051 |
Government expenditures/GDP | Gov/Y | 0.21 |
Government debt/GDP | Bond/Y | 0.0842 |
Labour income tax rate | τw | 0.318 |
Capital income tax rate | τk | 0.382 |
Consumption tax rate | τc | 0.10 |
7. Simulation results

|
Из за большого объема этот материал размещен на нескольких страницах:
1 2 |
