


Партнерка на США и Канаду по недвижимости, выплаты в крипто
- 30% recurring commission
- Выплаты в USDT
- Вывод каждую неделю
- Комиссия до 5 лет за каждого referral
Table 10. Average revenue per user, roubles
Index | ARPU | ||
2006 | 2007 | 2008 | |
Local communications | 177 | 210 | 211 |
Internet BRB | 742 | 544 | 482 |
IP TV | - | - | 200 |
Dial-up Internet access | 148 | 213 | 83 |
Fig.1. Revenue trends by service, millions of roubles*
*Information based on the data of Form 65-communication.
In 2008, the Company managed to increase its revenues from all kinds of communication services. For instance, the revenues from local communication services by the results of 2008 grew by 1% to RUR 12,828 million. The revenues from intra-zone communication grew by 8% compared to the previous year, and amounted to RUR 2,419 million. The revenue growth in the intra-zone communication segment was due both to an increase in the F2M traffic (calls from a fixed to mobile phone) and to active marketing actions by N. W.Telecom in this segment, such as the extension of the “Oblast” and “Oblast+” package offers (supplement to the package of calls to DEF.) The greatest revenue increase by the 2008 results was recorded in the data transmission and telematic communication services segment. The revenues from these services increased by 44% to RUR 4,163 million, of which, the Internet access services amounted to RUR 3,375 million (+49 % over 2007, despite some drop in ARPU from BBA services in 2008.) The growth of revenues from data transmission and telematic services was attributable to the nearly twofold increase of the BBA customer base.
The revenues from connection and traffic transmission services amounted in RUR 2,716 million in 2% against the year 2007.) The decrease of revenues from connection and traffic transmission services is attributable to the following:
· In accordance with Resolution No. 627 of the Russian Federation Government dated October 19, 2005 “On governmental regulation of prices for connection services and traffic transmission services provided by operators having an important status in the public communication network”, the compensation allowance to the price of local and zonal call initiation introduced by the said regulatory document from January 1, 2006 at the rate of RUR 0.38 per minute was cancelled from January 1, 2008.
· Resolution No. 666 of the RF Government dated October 12, 2007 “On amendments to certain RF Government acts related to communications” cancelled the connection points servicing fee from March 1, 2008.
Expenses
The expenses related to normal activities increased by 16.7% in 2008 compared to 2007, amounting to RUR 20,638 million. The main cause of the expense growth were actions for installation, upkeeping, and maintenance of payphones supporting ACS.
Table 11. The Company's expenses structure in , millions of roubles
Item | 2006 | 2007 | 2008 | Abs. deviation (2008/2007) | Rate of index change, 2008/2007 (%) |
Expenses for wages* | 5,296 | 5,758 | 6,383 | 625 | 110.9 |
Deductions for social insurance | 1,171 | 1,258 | 1,356 | 98 | 107.8 |
Depreciation | 2,495 | 3,008 | 4,179 | 1,171 | 138.9 |
Material expenses | 826 | 911 | 1,264 | 353 | 138.8 |
Expenses related to services of communication operators | 1,302 | 1,850 | 1,788 | -61 | 96.7 |
Expenses for Rostelecom OJSC services | 134 | 118 | 108 | -10 | 91.2 |
Services of outside organizations | 1,961 | 2,200 | 2,663 | 462 | 121.0 |
Taxes and fees included in the expenses for normal activities | 16 | 16 | 19 | 2 | 113.3 |
Rental | 244 | 242 | 247 | 5 | 102.2 |
Other expenses | 2,069 | 2,328 | 2,632 | 304 | 113.1 |
TOTAL | 15,513 | 17,689 | 20,638 | 2,949 | 116.7 |
*This line includes the wages and payments in accordance with the collective agreement and labor contracts. Source: the Company’s accounts for 2008 after the audit.
The most sizeable expense growth in 2008 against 2007 was recorded for the “Depreciation” and “Material expenses” lines. The depreciation costs increased by 38.9%, which is attributable to the large-scale commissioning of fixed assets (in particular due to the costs of the 2nd wave of all-in-one payphones installation) and changed depreciation rate (fixed assets useful life reduced from 2007.) The expense growth in the “Material expenses” line was 38.9%, which is mainly attributable to the necessity of social protection of the Company’s personnel for their better motivation and for retention of core staff, and to higher man-hours for ACS operation. Besides, the costs in the “Services of outside organizations” line grew noticeably by 21%, which was due to higher transport expenses related to ACS, and due to indication of the costs of upkeeping and maintenance of payphones for all-in-one communication services (2nd wave of ACS implementation.)
A 11% raise in wages was also recorded in 2008, related to the necessity of social protection of the Company’s personnel for their better motivation and for retention of core staff, and to higher man-hours for ACS operation.
The 13.1% growth of expenses in the “Other expenses” line was mainly due to the following costs:
- “Agency”: an increase of RUR 114 million (+26%) attributable to the larger scope of customer handling for BBA service sales due to the materially increasing competition on the NWFD market and in St. Petersburg in particular;
- “Electric power”: an increase of RUR 73 million (+19.8%) due to the tariff growth and changed structure of regulated and non-regulated tariffs;
- “Inventory and property assessment expenses”: an increase of RUR 74 million (+166.2%) due to registration of the title to the linear cable communication facilities.
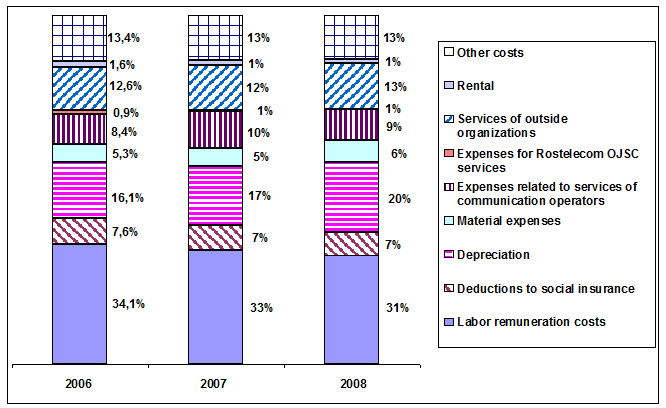
Fig. 2. The Company's expenses structure in , %
Investment Policy
In the reporting period, OJSC N. W.Telecom performed its investment activities in accordance with the key targets defined by the Board of Directors for the current year and enabling achievement of the entire range of goals faced by the Company:
· meet the target indices of numbers commissioned,
· develop and offer new hi-tech and highly profitable services,
· provide maximum satisfaction of users’ applications for connection to public use telephones,
· meet the Company’s social obligations.
Table 12. N. W.Telecom investment structure, millions of roubles
Investment area | 2006 | 2007 | 2008 | Rate of index change, 2008/2007 (%) |
Investment in the fixed capital, | 5,012 | 9,733 | 13,523 | 139 |
including: | ||||
investment in traditional telephony | 2,035 | 3,928 | 7,363 | 187 |
investment in new services and IT | 1,160 | 2,783 | 4,205 | 151 |
investment in transmission lines and communication infrastructure items | 1,142 | 1,592 | 1,348 | 85 |
other investment | 675 | 1430 | 607 | 42 |
In 2008, the investment in the fixed capital amounted to RUR 13,523 million, of which:
· new construction: RUR 5,882 million,
· reconstruction: RUR 2,420 million,
· expansion: RUR 3,628 million,
· upgrading: RUR 1,329 million,
· purchase of separate fixed asset items: RUR 266 million.
Within the framework of implementation of the national programs, the Company made the following capital investments:
Category | millions of roubles |
Socially significant investment programs and investments required to meet legislative requirements, in particular: | 6,206 |
· All-in-line communication service provision program | 4,191 |
· Program of compliance with legislative requirements (regulations), of which: | 2,015 |
traffic metering at the connection points | 0 |
engineering actions for network connection at the local and zonal level | 0 |
subscribers enabled to choose a network operator for national/international telephone communication | 0 |
ensuring the subscriber’s right to choose their telephone connection payment method | |
provision of a closed numbering system (Order 142) | 2,015 |
Assets
In the reporting period, the net assets grew by RUR 2,051 million, or by 7%, and reached RUR 31,013,641,000. The positive trend of this index shows a higher stability of the Company’s financial standing. The net assets size by the end of 2008 greatly (27.4 times) exceeds the size of the issuer’s authorized capital.

|
Из за большого объема этот материал размещен на нескольких страницах:
1 2 3 4 5 6 7 8 9 10 11 12 13 14 15 |
