


Партнерка на США и Канаду по недвижимости, выплаты в крипто
- 30% recurring commission
- Выплаты в USDT
- Вывод каждую неделю
- Комиссия до 5 лет за каждого referral
Proceeding from the above, we decided to allow athletes to apply musical accompaniment of the "rock" style in individual and group order.
Statistical analysis.
The digital material obtained during the research was processed using traditional methods of mathematical statistics. For each indicator, the arithmetic mean X, the standard deviation S (standard deviation), the standard error (m), the reliability of the differences between the parameters of the initial and final results, as well as between the control and experimental groups by the t-test of the Student with an appropriate level of significance (p).
Mathematical processing of data was carried out using programs for processing the results of scientific research Microsoft Exel "Data Analysis", SPSS. Differences were considered significant at a significance level of p <0.05.
Results.
The construction of the rugby training process in using the musical accompaniment of training sessions has had a positive effect both on the level of special physical and technical readiness of the players, and on their psycho-physiological state.
Regarding the psychophysiological state, it should be noted that the representatives of the experimental group in the test "Reaction of choice, the number of errors" the result has significantly improved (p <0,05), and in the control group, on the contrary, the result has significantly deteriorated (p <0,05 ) (Table 2). After the expert, the control and experimental groups began to differ significantly (Fig. 1).
Similar data were obtained in the tests "Response time of choice in feedback mode" (Fig. 2, Table 1, 2) and "Mental stability according to Schultt test" (Fig. 3, Table 1, 2). The athletes of the experimental group showed significant improvement (p <0.001, p <0.05), and athletes in the control group - a significant deterioration (p <0.01) of the test results. Experimental and control groups did not differ from each other until the experiment was performed (p> 0.05). After the experiment, the experimental and control groups significantly differed (p <0.001, p <0.05) according to the results of these tests (Figures 2, 3).
The number of errors when performing the test on the rate of reaction of choice indicates the quality, such as stability, endurance of the nervous system, which is also an indicator of the strength of the nervous system. Based on the data obtained, one can conclude that the athletes of the experimental group as a result of the use of musical accompaniment in classes increased the stability of the nervous system and its strength. In the control group, the decline in these indicators can be explained by the fact that the experiment was conducted in the beginning of the training season, and adaptation changes have just begun in the body. This causes inconsistency of the work of various systems of the body, including, and nervous, which explains the increase in errors in the athletes of the control group when passing the test on the rate of reaction of choice.
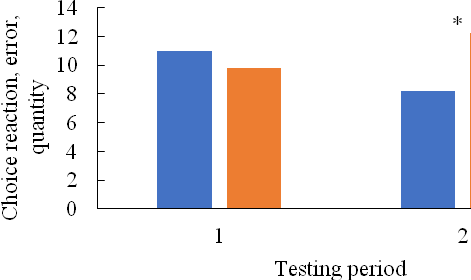
Fig. 1. Results of the test "Response of choice, errors" by athletes of the experimental and control groups before and after the experiment:
1 – before the experiment, 2 – after the experiment;
- experimental group; control group
* - the differences are significant at р<0,05
It should be noted that athletes of the experimental group, the beginning of the training season did not have a negative effect on the psycho-physiological state. One can conclude that the use of musical accompaniment at the training contributed to the coherence of the work of different systems of the body and increase the strength and stability of the nervous system.
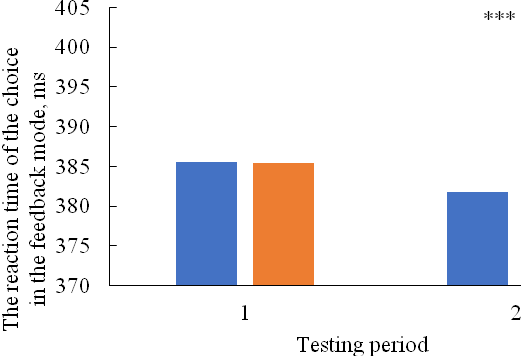
Fig. 2. Results of the test "Response time of choice in feedback mode" by athletes of the experimental and control groups before and after the experiment:
1 – before the experiment, 2 – after the experiment;
- experimental group; control group
*** - the differences are significant at р<0,001
The test "Response time of choice in feedback mode" reflects the slowness and mobility of the nervous system, and the "Mental resistance of the Schultt test" reflects the endurance of the nervous system. It is also an indicator of the strength of the nervous system. It is determined that the use of musical accompaniment primarily affects the strength and stability of the nervous system.
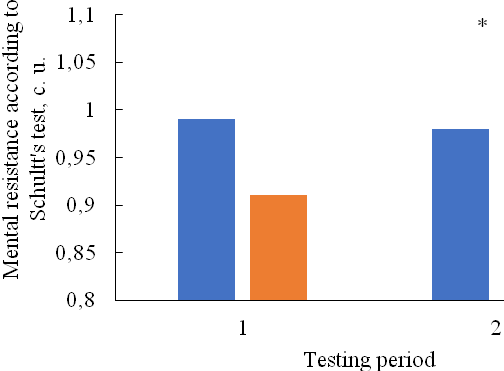
Fig. 3. Results of the test: "Psychological stability of the Schulte test" by athletes of the experimental and control groups before and after the experiment:
1 – before the experiment, 2 – after the experiment;
- experimental group; control group
* - the differences are significant at р<0,05
Table 1
Indicators of the pyo-physiological state of young rugby players of the control group before and after the experiment (n=10)
Name | Group | Statistical Displays | ||||
| S | m | t | р | ||
Time of simple reaction, ms | CB | 360,20 | 28,65 | 9,06 | 3,20 | 0,00 |
CA | 327,80 | 14,26 | 4,51 | |||
Simple reaction, error, quantity | CB | 0,20 | 0,42 | 0,13 | 1,50 | 0,15 |
CA | 0,00 | 0,00 | 0,00 | |||
Time of simple reaction, mean square deviation, ms | CB | 2,77 | 0,02 | 0,01 | 1,50 | 0,15 |
CA | 2,76 | 0,00 | 0,00 | |||
The time of the reaction of choice, ms | CB | 447,80 | 18,15 | 5,74 | -1,44 | 0,17 |
CA | 462,00 | 25,33 | 8,01 | |||
Reaction of choice, errors, quantity | CB | 9,80 | 2,15 | 0,68 | -2,78 | 0,01 |
CA | 12,20 | 1,69 | 0,53 | |||
The time of the reaction of choice, the mean square deviation, ms | CB | 3,41 | 0,18 | 0,06 | -2,82 | 0,01 |
CA | 3,65 | 0,19 | 0,06 | |||
The reaction time of the choice in the feedback mode, ms | CB | 385,40 | 15,25 | 4,82 | -2,32 | 0,03 |
CA | 402,80 | 18,18 | 5,75 | |||
Reaction selection in feedback mode, errors, number | CB | 23,80 | 1,23 | 0,39 | 4,03 | 0,00 |
CA | 20,40 | 2,37 | 0,75 | |||
The response time of the choice in the feedback mode, the mean square deviation, ms | CB | 3,80 | 0,16 | 0,05 | -0,55 | 0,59 |
CA | 3,83 | 0,10 | 0,03 | |||
Reaction selection in feedback mode minimum exposure time, ms | CB | 336,00 | 15,78 | 4,99 | -0,28 | 0,78 |
CA | 340,00 | 42,16 | 13,3 | |||
Reaction selection in feedback mode, total test run time, p | CB | 89,20 | 2,15 | 0,68 | -2,12 | 0,05 |
CA | 92,00 | 3,59 | 1,14 | |||
Reaction selection in feedback mode, exit time to minimum exposure, p | CB | 69,60 | 13,70 | 4,33 | 1,13 | 0,27 |
CA | 62,80 | 13,14 | 4,15 | |||
Dynamic choice reaction for 60 s (Ermakov test), quantity | CB | 87,40 | 9,37 | 2,96 | -0,16 | 0,88 |
CA | 88,20 | 12,81 | 4,05 | |||
Dynamic choice reaction for 60 s (Ermakov's test), errors | CB | 1,42 | 1,43 | 0,45 | 0,00 | 0,99 |
CA | 1,40 | 1,07 | 0,34 | |||
The work time on Table 1 in the Schult test, s | CB | 34,80 | 6,51 | 2,06 | 0,84 | 0,41 |
CA | 32,00 | 8,30 | 2,62 | |||
The work time on Table 2 in the Schult test, s | CB | 41,40 | 9,25 | 2,93 | 2,37 | 0,03 |
CA | 37,66 | 15,84 | 5,01 | |||
Time worked on table 3 in the Schult test, s | CB | 35,40 | 7,26 | 2,30 | 2,13 | 0,05 |
CA | 38,60 | 7,04 | 2,23 | |||
The work time on Table 4 in the Schult test, s | CB | 45,20 | 18,23 | 5,76 | 2,76 | 0,01 |
CA | 38,20 | 6,91 | 2,18 | |||
The work time on table 5 in the Schult test, s | CB | 44,60 | 18,92 | 5,98 | 1,74 | 0,10 |
CA | 33,00 | 9,24 | 2,92 | |||
Efficiency of the Schultt test (c. u.) | CB | 39,76 | 10,25 | 3,24 | 1,84 | 0,08 |
CA | 32,36 | 7,50 | 2,37 | |||
Degree of training on the Schultt test (c. u.) | CB | 0,89 | 0,08 | 0,03 | -1,88 | 0,08 |
CA | 1,00 | 0,16 | 0,05 | |||
Mental Stability Test by Schult (c. u.) | CB | 1,10 | 0,09 | 0,06 | 1,27 | 0,09 |
CA | 1,07 | 0,04 | 0,04 |
Note: CB - control group for experiment; CA - control group after experiment

|
Из за большого объема этот материал размещен на нескольких страницах:
1 2 3 4 5 |
