

Партнерка на США и Канаду по недвижимости, выплаты в крипто
- 30% recurring commission
- Выплаты в USDT
- Вывод каждую неделю
- Комиссия до 5 лет за каждого referral
As Megan Mcardle reminds us:
Hoover did not tighten up on spending. According to the historical tables of the Office of Management and Budget, spending in 1929 was $3.1 billion, up from $2.9 billion the year before. In 1930 it was $3.3 billion. In 1931, Hoover raised spending to $3.6 billion. And in 1932, he opened the taps to $4.7 billion, where it basically stayed into 1933 (most of which was a Hoover budget). As a percentage of GDP, spending rose from 3.4% in 1930 to 8% in 1933--an increase larger than the increase under FDR, though of course thankfully under FDR, the denominator (GDP) had stopped shrinking.
Herbert Hoover: the father of the New Deal, no matter what your tenured professor tells you.
Forbes
Thomas Piketty Gets The Numbers Wrong
by Louis Woodhill
Given the excitement that Thomas Piketty’s new book, Capital in the Twenty-First Century, has stirred up within the political left, the French economist probably should have titled it Fifty Shades of Inequality.
In Capital, Piketty presents a painstakingly researched case for doing what progressives ranging from Paul Krugman to Barack Obama want to do anyway, which is to raise taxes and expand the power and reach of government. Unfortunately for liberals, Piketty gets almost everything wrong, starting with the numbers.
Piketty claims that capitalism is in crisis, because the importance of capital in our economy is growing, the “Top 10%” owns most (70%) of it, and the “Bottom 50%” owns almost none (5%) of it. However Piketty’s numbers ignore the capitalized value of Social Security, Medicare, and our other welfare state programs. These programs are huge, and they disproportionately benefit the “Bottom 50%.”
Social Security and Medicare are “pay as you go” social programs (which Piketty calls “PAYGO”). While Social Security and Medicare may not add anything to the physical capital of the economy as a whole, from the point of view of the individuals enrolled in the programs, they represent capital. Specifically, the Social Security and Medicare contributions function as forced savings, and the benefits function as annuities. And, Piketty certainly counts annuities owned by “the rich” as part of their wealth.
Social Security and Medicare are structured such that the capital accumulation from the forced savings of the lower income classes is heavily augmented by subsidies paid for by the higher income classes.
The ultimate example of this might be the case of the first Social Security benefits recipient, Ida May Fuller, who was definitely not in the “Top 10%.”
Ms. Fuller received about $180,000 in Social Security benefits, in return for a bit more than $400 in contributions (both numbers in today’s dollars). And, she also received 10 years of Medicare coverage for nothing.
Living requires income. In Piketty’s model, there are only two kinds of income: income from labor, and income from capital. Because Ms. Fuller didn’t work for the last 35 years of her life, she must have lived off income from capital. Ms. Fuller must therefore have owned significant capital (in the form of her claim on the Social Security Administration) when she retired in 1939. Because Piketty’s wealth distribution numbers do not take this form of capital into account, they are simply wrong.
But wait! Social programs are just promises by the government to pay, and they could be repudiated at any time.
Yes, but government bonds are also nothing more than government promises to pay, and Piketty counts them as private wealth. Government bonds can be (and have been) repudiated, both directly (Argentina, Greece) and via inflation (almost everywhere).
Because high earners receive a return on their contributions that is lower than the interest rate on federal debt, the entire “unfunded liabilities” of Social Security and Medicare must logically arise from the benefits promised to the “Bottom 50%.” Let’s see how taking these unfunded liabilities into account would affect Piketty’s numbers.
Piketty estimates that, in 2010, the U. S. had total national wealth of about $54 trillion. The “Top 10%” owned 70% of this, the “middle class” (the next 40%) held 25% of the total, and the “Bottom 50%” owned 5%.
If we assume that the (75-year) unfunded liabilities of Social Security and Medicare ($9.6 trillion as of 2010) will ultimately be dealt by taxing “the rich” (i. e., the “Top 10%”), then the true U. S. wealth distribution in 2010 was actually much different than the one that Piketty describes.
After adjustment for the capitalized value of Social Security and Medicare, in 2010, the “Top 10%” actually owned 52.2% of national wealth, not much more than the 50% observed for this group in 1970s – 1980s Scandinavia, which was the society with the lowest inequality that Piketty has ever found. And, the “Bottom 50%” really held 22.8% of total wealth, close to the 25% that Piketty believes would pertain in an “Ideal Society.” (See Table 7.2 in Capital.)
But wait! There’s more! Specifically, there is a lot more to the U. S. welfare state (which Piketty calls “the social state”) than just Social Security and Medicare.
Because Piketty presents (purportedly) comparable data from 1870 to 2010, and draws comparisons between the Belle Epoch (1870 to 1914) and the present, it is literally shocking that Piketty ignores the impact of welfare programs on the effective distribution of capital.
Piketty cites literature from around 1900 to make points about inequality of wealth. Many of the characters in the novels of Jane Austen and Honore de Balzac did not work, and never expected to work. Work was simply not a part of the lives of people in their social class.
This lifestyle was made possible by the Austen/Balzac characters’ ownership of capital, the rents from which provided them with annual incomes of 50 to 100 times that of the average citizen of the time. So, for Piketty, the big deal about owning capital is that it provides income that you don’t have to work for.
Well, the U. S. currently has more than 100 million working age people that don’t work. Many of these people are being supported by family members, but there are millions of adults (18 – 65) that are living off our welfare state (including Social Security Disability). Because these people don’t have labor income, in Piketty’s model, they must be paying their bills with capital income.
Hmmmm. People that are able to live for years, if not their entire lives, without working. Sounds like characters in a Jane Austin novel, doesn’t it?
But wait! Jane Austen’s characters were rich, and people on welfare in the U. S. are poor, right? Well, let’s see.
If America’s welfare population (along with their lifestyles) were put in a time machine and sent back to the France of 1870, they would be viewed by the ordinary people of that time as a strange new aristocracy.
Our welfare recipients would be envied for their (comparatively) ample and varied food, (comparatively) large dwelling units, (comparatively) huge selection of clothing, amazing creature comforts (e. g., electric lights, indoor plumbing, air conditioning, washing machines, etc.), ability to travel at 80 miles an hour, capability to communicate with each other at the speed of light, and access to dazzling entertainment via flat panels on their walls.
However, what the ordinary French citizens of 1870 would probably be most envious of regarding our welfare population is their immunity to common infectious diseases, as well as their ability to easily cure the ones that they did get. And, of course, the ordinary people of 1870 France would envy our welfare recipients for the fact that they enjoyed their incredible lifestyle without having to work.
We can stop this line of discussion here. The point is that Piketty’s painstakingly researched numbers are worthless, because they ignore the existence of the modern welfare state. Our various welfare programs redistribute a huge percentage of national income, and, therefore, for the purposes of Piketty’s comparisons across time, they redistribute the beneficial ownership of capital.
Now, let’s move on to the (many) other things that Piketty gets wrong.
Piketty seems to assert that it is possible (starting from here) to greatly increase the value of society’s capital without, at the same time, greatly increasing its income. This is the only way that the capital/income ratio could double, as Piketty predicts that it will in the 21st century. However, the “Produced Assets” numbers from the U. S Bureau of Economic Analysis (BEA) belie Piketty’s thesis.
As shown below, the GDP yield from nonresidential assets (valued at “market”) has remained fairly constant over the past 62 years, oscillating around a mean value of about 44%.
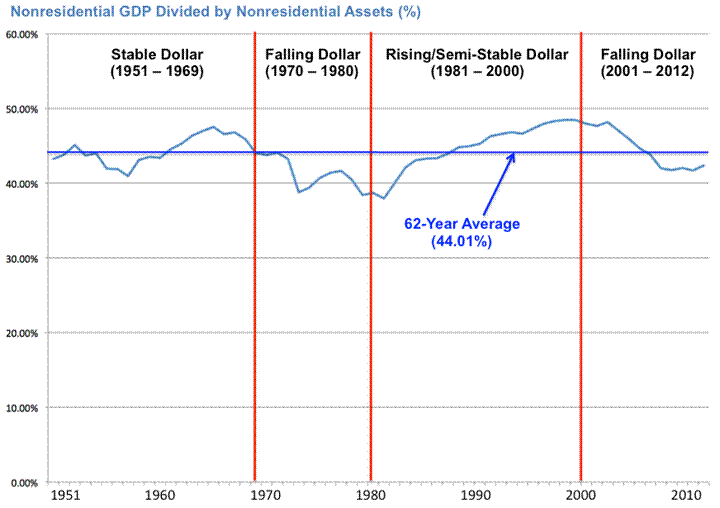
There is a lot to this chart. For now, just note that the BEA data contradicts Piketty’s prediction of an endlessly growing ratio of capital to national income. It also suggests that our growth rate is not limited to the 1.5%/year that Piketty projects. We could grow faster if we accumulated nonresidential assets faster. And, we could accomplish this by giving our companies and entrepreneurs an environment that is more conducive to investing capital within the U. S.
As an aside, residential assets produce a GDP return of about 8%. Even at this low rate of capital productivity, residential assets can produce the 5% return on capital for their owners that Piketty expects. This is because, as the BEA does the numbers, producing housing services (from existing residential assets) doesn’t require any labor.
Piketty predicts that a slowdown in population growth will reduce the maximum sustainable growth rate of GDP. In saying this, Piketty buys into the superstition that:
GDP growth rate = labor force growth rate + productivity growth rate
The equation above is an accounting identity, and it is true by definition. However it is not an accurate description of cause and effect. At least for real GDP growth rates between 0% and 4%, the correct equation is:

|
Из за большого объема этот материал размещен на нескольких страницах:
1 2 3 4 5 6 7 |
