

Партнерка на США и Канаду по недвижимости, выплаты в крипто
- 30% recurring commission
- Выплаты в USDT
- Вывод каждую неделю
- Комиссия до 5 лет за каждого referral
For display may be chosen (read out with the store) or cleared from failures. For switching between these modes there is a button of a Speed bar. When the button is clicked, the cleared information is out put, when is pressed - initial. The button is kept with transition in a window of the table.
5.2.2. Choice of parameters for an out put to the diagram
The choice of analog parameters (AP) and event signals (ES) for a out put to the diagram can be made as directly from the list registered and of calculation parameters, and by means of a choice of a standard set.
For a change of the list of parameters, inputing to the diagram:
1. Press the button ![]() of the Speed bar or in the contextual - dependent menu choose a command «Modification of set ». The window « Select parameter » (Figure 23) is removed.
of the Speed bar or in the contextual - dependent menu choose a command «Modification of set ». The window « Select parameter » (Figure 23) is removed.
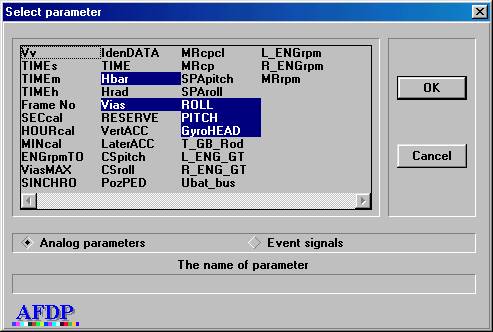
Figure 23. Dialogue of a choice of parameters
2. Press the radio button « Analog parameters » and select in the list the necessary analog parameters.
3. Press the radio button « Event signals » and select in the list the necessary event signals.
4. After a choice of required parameters press the button «OK».
For change of the list of parameters, on the diagram, by means of a standard set:
1. Press the button ![]() of the Speed bar or in the contextual - dependent menu choose a command «Load set». The window «Select set» (Figure 24) is appeared.
of the Speed bar or in the contextual - dependent menu choose a command «Load set». The window «Select set» (Figure 24) is appeared.
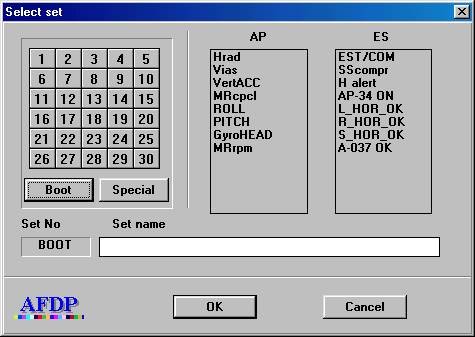
Figure 24. A window of a choice of a set
2. Press the button with the necessary number of a set.
3. Press the button «OK».
5.2.3. Change of scale of display of analog parameters and places of their situation on the screen
For identification of parameters submitted on the diagram two floating windows – «Analog parameters» and «Event signals» (Figure 25) serve.
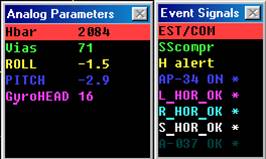
Figure 25. Windows of analog parameters and single teams
For appearance of a window « Analog parameters » in a window of the diagrams press the button ![]() . For deletion press this button for two times.
. For deletion press this button for two times.
For appearance of a window « Event signals» in a field of the diagrams press the button ![]() . For deletion press this button for two times.
. For deletion press this button for two times.
In the a window " Analog parameters " there is a list of analog parameters submitted on the diagram and their a code or physical value. The meanings of parameters correspond to a position, in which there is a cursor in the current moment. The switching a code / physics is made in the contextual - dependent menu by a choice of a command " Physical values ". If this command is marked - the output of physical values of parameter is made, if there are no - codes.
In a window " Event signals " accordingly there is a list of single commands. If the single command is registered in section of the cursor, opposite its name there is a mark "*".
The change of a position of the cursor is made with the help of the mouse or the buttons of the keyboard «ï» and whether «ð».
For change of a situation of an analog parameter on the diagram or scale of its representation it is necessary to introduce a line with a designation of this parameter in the window " Analog parameters ". Further with the help of the buttons «ñ»or «ò»moving the diagram of parameter accordingly upwards or downwards is made. With the help of the buttons «PgUp» or «PgDn» the increase or reduction of scale is made.
5.2.4. Creation and updating of standard sets of parameters
After a choice and convenient accommodation of a set AP and ES on the diagram it can be remembered as a standard set. For it in the contextual - dependent menu choose a command « Save set as ». In the appeared window of the dialogue « Select set » (Figure 24) to choose the number of a set, in which the combination will be written down, and to press the button «OK».
The updating of a set is made similarly to creation, only as an initial condition it is necessary to load a corrected set.
ATTENTION! It is forbidden to make updating of first ten sets, as they are used by the program of the express - analysis for an output of confirming the event of the diagrams.
5.2.5. Output to the diagram of the given area of the flight
The output to the diagram of the given area of the flight is carried out by one of the these ways:
Increasing of the chosen flight area. Press the button «Shift» and not releasing (letting off) it establish the cursor of the mouse by the beginning of the area, which it is necessary to increase. Press the left button of the mouse and not releasing (letting off) it select the chosen area. After dismissing of the left button of the mouse the selected area will be appeared on the whole screen. The minimal time interval, which can be submitted in such a way on the diagram is - 1 second (1 staff).
Output the whole flight. Press the button ![]() in the Speed bar. On the diagram the whole flight is appeared.
in the Speed bar. On the diagram the whole flight is appeared.
Transition to the following area of flight. Press the button ![]() in the Speed bar. On the diagram the following on time area of flight is appeared.
in the Speed bar. On the diagram the following on time area of flight is appeared.
Transition to the previous area of flight. Press the button ![]() in the Speed bar. On the screen the previous interval by the period of time of flight is represented.
in the Speed bar. On the screen the previous interval by the period of time of flight is represented.
Expansion of the area to the left on half of current size. Press the button ![]() in the Speed bar. On the screen the interval of flight is represented extended on half to the left by the period of time.
in the Speed bar. On the screen the interval of flight is represented extended on half to the left by the period of time.
Expansion of the area to the right on half of current size. Press the button ![]() on the Speed bar. On the screen the interval of flight is represented extended on half to the right by the period of time.
on the Speed bar. On the screen the interval of flight is represented extended on half to the right by the period of time.
5.3. PRINTING THE DIAGRAMS.
For output of the diagrams to the printer see if, the printer is connected to PC.
The output is carried out in a format « What I see, that I get », therefore before printing it is necessary to choose a desirable set of parameters, temporary range to place the names (analog parameters and event signals) and markers of a output of meanings of parameters. About a choice and accommodation of parameters was written above, therefore let´s stop on labels and markers.
The label for an analog parameter is the reduced name of an appropriate parameter. A parameter or event signal can be marked only in one place of the diagram. For it it is necessary to choose a parameter in the window « Analog parameters » or event signal in the window « Event signals » to move a marker of the cursor to that place on the diagram, where you should put down a name of parameter and to press the button «N» for the analog parameter or «R» for a event signal. The name AP will appear above the diagram of the given parameter, and the name ES will rise in the same level of the event signal.
Set up of a marker is necessary, when it is required to receive with printing directly on the diagram in the given section in a digital kind of meaning of analog parameters. For it it is necessary to move the cursor to that place, where it is necessary to put a marker and to press the button «M». Thus the meanings of parameters will be displayed with the printing the diagrams. On the screen this place of the diagram is marked by the vertical white marker.
To print of the prepared diagram press the button ![]() of the Speed bar or in the contextual - dependent menu choose a command «Print of the graph». Thus there is a window of input of the comment to the diagram (Figure 26).
of the Speed bar or in the contextual - dependent menu choose a command «Print of the graph». Thus there is a window of input of the comment to the diagram (Figure 26).
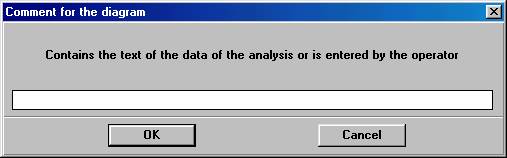
Figure 26.
· Input from the keyboard the text of the comment to the diagram and press the button «OK». In the appeared window of set-up of the printer press the button «OK» after set-up of the printer.
5.4. Tabulared representation of the flight information
For representation of parameters of flight as the table, being in a window of the diagrams press the button ![]() or in the contextual - dependent menu choose a command «Сreate the table».
or in the contextual - dependent menu choose a command «Сreate the table».
The table consists of meanings chosen through the of the parameters submitted on the diagram with the given temporary step and a format of a output (Figure 27).
The change of parameters of a temporary step and format of an output is made with the help of commands contextual - dependent menu of a window of the table:
1. "Step" - for installation of an interval through which is made sample of the data in the table (from 1/8 seconds up to any, given by the operator).
2. "Value" - for installation of a format of typed out sample, given on chosen intervals, of the data (nearest, average, minimum, maximum and max/min).
3. "Interpolation" - for account of meanings of parameters having frequency of interrogation of the less established step (a step less 1 sec), in intermediate points.

|
Из за большого объема этот материал размещен на нескольких страницах:
1 2 3 4 5 |
