
Партнерка на США и Канаду по недвижимости, выплаты в крипто
- 30% recurring commission
- Выплаты в USDT
- Вывод каждую неделю
- Комиссия до 5 лет за каждого referral
The literature suggests that a large component of TFP can be attributed to technical change. Technical change, accounting for 2% p. a., arises from public and private investments in research and extension where a significant component of both activities is related to the adaptation of foreign knowledge spillins. This scenario attributes none of the productivity growth to scale economies or gains in technical efficiency.
MANSON AND BLACK???
The contribution of foreign knowledge to productivity growth means that rates of return to research, which only include Australian investment in research, will be overestimated to some extent, while acknowledging that Australian R&D resources are required to adapt foreign knowledge to Australian conditions[26]. Alston (2002) has argued that, certainly between states, but even between nations, foreign research may be as important as domestic research. The extent of spillovers depends on similarities in climate and land resources and on the nature of agriculture. Australia’s climate and its dependence on broadacre agriculture, particularly a unique wool industry, suggests that foreign spillovers while still important to Australia, consider chemicals and machinery for example, may be less important than domestic knowledge. It has been assumed that for Australian broadacre agriculture, domestic R&D activities may be responsible for productivity growth in the order of 1.2% p. a. and foreign spillins for 0.8% p. a. – a 60:40 split.
Two scenarios for investment analysis relate Australian R&D investment first, to productivity growth at the rate of 2.0% p. a. and second, to productivity growth at the rate of 1.2% p. a. These scenarios ‘bracket’ the potential benefits from domestic research. Under assumptions used in this report, domestic research generates productivity gains of at least 1.2% but some productivity gains, 0.8%, are picked up from foreign sources without any domestic mediation. It is more likely the case that some domestic research is required to capture the benefits from foreign spillovers. At the extreme, domestic research is required to capture any of these foreign benefits, hence domestic R&D can lay claim to the whole 2.0% gain.
Based on these assumptions, Figure 6 decomposes the value of all productivity gains in Australian agriculture since 1953 into those attributable to domestic R&D and those attributable to other sources of productivity including foreign knowledge and domestic sources such as public infrastructure and farmers’ education[27]. It has been assumed that prior to 1969, productivity grew at 2.0% (80% of its current rate).
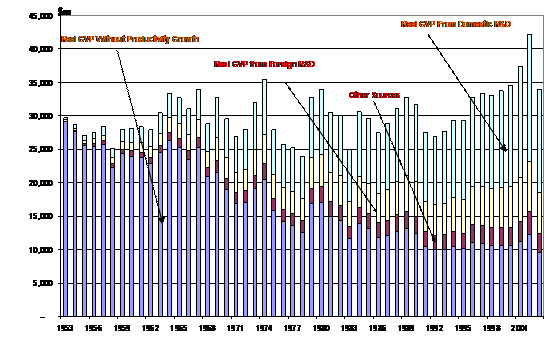
Figure 6: Sources of productivity growth in Australian agriculture (in 2004 dollars): 1953–2003.
Holding technology at its 1953 state, less than 30% of the value of output in 2004 can be accounted for by conventional inputs (represented by the blue bars). Seventy percent of the value of farm output arises from the various sources of productivity growth such as improvements in infrastructure and communications, higher quality inputs, and new technologies from research and extension activities. Almost half the value of output in 2003 can be attributed to new technology generated by domestic research since 1953 (represented by the aqua bars). At a real rate of interest of 4%, the compound value of the stream of benefits from domestic research from 1953–2003 is A$878 billion (in 2004 dollars).
As pointed out in Mullen (2002) the benefits of new technology in Australian agriculture are shared with producers, processors and consumers who are non-residents of Australia. On the basis of previous research into the distribution of the benefits from research, he estimated that perhaps Australian producers, processors and consumers retain 80% of benefits or about A$700 billion in this case.
The data series on public research investment presented above was backcast to 1918 to allow the estimation of models with research lags of 35 years. The compound value of public investment in research between 1953 and 2003 has been A$64.5 billion and the estimated total back to 1918 has been A$77.4 billion (in 2004 dollars). Mullen (2002) estimated that private R&D in Australia and public extension expenditure might add a further 40% to domestic R&D investment, giving a total of A$90.3 billion since 1953 and A$108 billion since 1918 (in 2004 dollars).
These benefit–cost data allow an indicative assessment of returns from research in Australian agriculture under a number of scenarios (Table 6). Note that for these benefit cost scenarios, only benefits between 1953 and 2003 were recognised, a conservative approach particularly with respect to the flow of future benefits. Costs between 1918 and 2003 were recognised. Results are sensitive to this assumption.
Table 6: Rates of return to research in Australian agriculture.
Scenario: | Benefit-Cost Ratio | IRR |
Productivity growth @ 2.0%: | ||
(a) Public research only | ||
R&D from 1918 | 17.0 | 17% |
R&D from 1953 | 20.5 | |
(b) Public + private research + extension | ||
R&D from 1918 | 12.2 | 16% |
R&D from 1953 | 14.6 | |
(c) (b) + Gains to Australians only (80%) | ||
R&D from 1918 | 9.7 | 15% |
R&D from 1953 | 11.7 | |
Productivity growth @ 1.2%: | ||
(a) Public research only | ||
R&D from 1918 | 11.3 | 16% |
R&D from 1953 | 13.6 | |
(b) Public + private research + extension | ||
R&D from 1918 | 8.1 | 15% |
R&D from 1953 | 9.7 | |
(c) (b) + Gains to Australians only (80%) | ||
R&D from 1918 | 6.5 | 14% |
R&D from 1953 | 7.8 |
Under the most optimistic scenario where all productivity gains at the rate of 2.0% are attributed to domestic research investments made since 1918, the internal rate of return (IRR) is 17% and the benefit-cost ratio is 17.0:1. If it is assumed that productivity gains from domestic public and private research and extension result in productivity gains of 1.2% then the IRR is 15% and the benefit-cost ratio is 8.1:1. In both these scenarios, benefits from this stream of research investments accruing after 2003 for potentially many more years are ignored.
These IRRs, based on gross benefits, are most comparable to those normally reported in the literature. Table 6 also reports IRRs and benefit-cost ratios for scenarios in which the leakage of benefits to non-residents of Australia is recognised and which are a little lower.
All estimated IRRs are within the range first suggested by Mullen and Cox (1995), although at the lower end of this range.
Conclusions
While there is some evidence that productivity growth in the cropping sector has declined in the past decade, for Australian broadacre agriculture as a whole, productivity growth has remained at around 2.5 percent per year. It has been high relative to other sectors of the Australian economy and relative to the agricultural sectors in other OECD countries. In particular, the ratio of productivity growth in Australian agriculture to productivity growth in the Australian economy as a whole has been high relative to other countries. Over the past decade, the terms of trade facing Australian farmers has declined at a much slower rate. Hence it is likely that productivity growth has improved the competitive position of Australian agriculture. Despite a series of poor seasons, the real value of output from Australian agriculture has remained consistently above $30 billion for the first time since the early 60s.
While productivity growth has remained high, public investment in agricultural research in Australia has been static ($700m in 2004 $s) for two decades and has declined in research intensity terms while the research sector has continued to evolve both in terms of where investments are made and how they are managed. The ABS statistics reveal a shift in research resources to plant industries from animal industries which may underpin average productivity growth given the observed higher rates of productivity growth in the cropping industries. The increasing importance of funding through RDCs and CRCs may well mean that a greater proportion of research investment is of an applied nature, boosting productivity growth in the short run but perhaps at the expense on growth in the longer term.
The pursuit of environmental outcomes through agricultural research is a more dominant influence in the management of public research than previously. While investment in research in ABS Socio-Economic Objective Classification categories related to agriculture has grown little, it is likely that investments in research by traditional agricultural research agencies now classified as having environmental objectives has grown[28]. Within agricultural research institutions, much of this environmental research is focused on developing technologies to ameliorate or accommodate degradation in a manner profitable to farmers. Hence, some investment in environmental research is likely to be underpinning continued productivity growth in agriculture.
The joint nature of agricultural and environmental outcomes and the inadequate accounting for environmental outcomes is a source of bias in the measurement of productivity, research investment and returns to research, particularly from society’s perspective. A common view has been that traditional measures overstate productivity growth because they ignore resource degradation. The focus on improved environmental outcomes from agricultural technologies, still unmeasured, means that this bias is at least smaller and in some agricultural systems may be negative.

|
Из за большого объема этот материал размещен на нескольких страницах:
1 2 3 4 5 6 7 8 |
