
Партнерка на США и Канаду по недвижимости, выплаты в крипто
- 30% recurring commission
- Выплаты в USDT
- Вывод каждую неделю
- Комиссия до 5 лет за каждого referral
Ball V. E., J. C. Bureau, R. Nehring, and A. Somwaru. “Agricultural Productivity Revisited.” American Journal of Agricultural Economics, 79(4)(November 1997): 1045-63.
Ball V. E., F. M. Gollop, A. Kelly-Hawke, and G. P. Swinand. “Patterns of State Productivity Growth in the U. S. Farm Sector: Linking State and Aggregate Models.” American Journal of Agricultural Economics, 81(1)(February 1999): 164-179.
Jin, S., S. Rozelle, J. M. Alston, J. Huang. “Economies of Scale and Scope and the Economic Efficiency of China’s Agricultural Research System.” International Economic Review 46(3)(August 2005): 1033-1057.
Pardey, P. G., J. M. Alston, and N. E. Beintema. “Agricultural R&D Spending at a Critical Crossroads.” Farm Industry Journal 3(1)(February 2006): 1-10.
Pardey, P. G., J. M. Alston, and R. R. Piggott eds. Agricultural R&D Policy in the Developing World: Too Little, Too Late? Washington DC: International Food Policy Research Institute, 2006.
Pardey, P., N. Beintema, S. Dehmer, and S. Wood. Agriculture Research and Development: A Growing Global Divide? IFPRI Food Policy Report, Washington, DC: International Food Policy Research Institute, 2006.
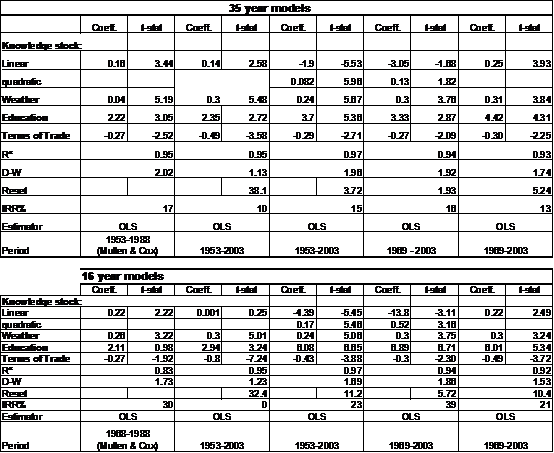
Table 5: Econometric Results and IRRs from the 35 and 16 year lag models
[1] Little, perhaps less, is known about returns from other areas of public sector investment.
[2] Modern in the sense of being based on a locally flexible functional form that can be interpreted as giving a second order approximation to an arbitrary production function.
[3] This remained the standard approach in Australia until Mullen and Cox (1996), following Diewert’s (1992) recommendation, used the Fisher index to measure productivity.
[4] The tenor of a symposium at the 2006 IAAE Conference titled ‘Global Agricultural Productivity Slowdown—Measurement, Trends and Forces’ was that growth was likely to fall in some countries but empirical evidence confirming this is yet to be published.
[5] Most of the studies referred in this section are based on ABARE broadacre or grazing industry survey data from farms engaged in various combinations of extensive crop and livestock production. Results for broadacre agriculture refer to the whole sample. Results for specialist croppers on livestock producer are based on sub-samples.
[6] Some ABARE reports are prepared from the perspective of broadacre agriculture while the more recent reports take the perspective of the grains industry and hence it is not always clear that the same classifications are being used over time.
[7] Estimated as the coefficient on a time trend in a regression against the log of TFP and a constant.
[8] The average annual growth rate for 1995-2003 was 0.1 percent
[9] Parham (2004) estimated productivity growth between ‘the same points in successive productivity cycles, from productivity peak to productivity peak’.
[10] For the period 1991 – 2004 (used in Figure 1) there was no trend in the terms of trade.
[11] An improvement in the terms of trade is similar in effect to an improvement in TFP because from the same resource base more output is available on the domestic market while the trade balance is unchanged.
[12] The data here are based on total expenditure by research providers from all sources. Important sources of funds to public research providers have been the RDCs.
[13] Both GDP and GVP were expressed as five year moving averages to remove trends purely related to seasonal conditions.
[14] Fisheries and Forestry have not been included in either R&D expenditure or in GVP and GDP.
[15] RDC levies are generally based on the value of production.
[16] Pardey (m.) expects to complete a revision of this paper in 2006.
[17] These rates of return are low relative to past studies but they accounted for the leakage of research benefits to non-residents of Australia and the excess burden of raising taxes to fund research.
[18] Forty three estimates were reported ranging from 2.5–562% with a mean of 87.3.
[19] The other three were Alston et al. (19.1%), Pardey (22.3%) and Scobie (22.6%).
[20] There was a problem of double counting capital and labour in estimating the returns to the other industry sectors. This does not appear to be a problem for the agricultural sector where the control variable was public rather than business investment in research. They estimated that without this seemingly unnecessary adjustment the rate of return to public investment in agriculture was 32%.
[21] The sum of normalised recursive residuals estimated by adding observations in a forward direction (Brown, Durbin and Evans, 1975).
[22] As suggested by Garry Griffith.
[23] The t-statistic for the introduced variable associated with the interaction term was larger for both the 16 and 35 year models.
[24] The t-statistic on the introduced variable in the 16 year model associated with the 35 year model was over 3 for both the J – and JA – tests and the corresponding variable in the 35 year model was not significantly different from zero.
[25] Again using the same procedure as Mullen and Cox, the implied IRRs for extension are 7 and 13 percent per annum for the 16 and 35 year models.
[26] They will be understated from a global perspective because the benefits other nations received from Australian R&D are not recognised.
[27] Using a methodology developed by Alston et al. (1994).
[28] Published ABS data on environmental research do not identify where the research is undertaken.

|
Из за большого объема этот материал размещен на нескольких страницах:
1 2 3 4 5 6 7 8 |
