
Партнерка на США и Канаду по недвижимости, выплаты в крипто
- 30% recurring commission
- Выплаты в USDT
- Вывод каждую неделю
- Комиссия до 5 лет за каждого referral
Earth Science SOL Review Sheet #1 : Scientific Investigations
Essential Knowledge and Skills
· Measure mass and volume of materials in the lab.
· Calculate density.
· Interpret data from a graph or table that shows change in mass, density, or temperature over time.
· Interpret data from a graph or table that shows change in temperature or pressure with depth.
· Construct a graph, table, chart, and/or diagram from data.
· Interpret graphs and diagrams.
· Use scientific methodology to design and test a hypothesis.
· Compare and contrast hypotheses, theories and scientific laws. For example, students should be able to compare/contrast the Law of Superposition and the Theory of Plate Tectonics.
· Make predictions using scientific data and data analysis.
· Use data to support or reject a hypothesis.
· Explain how the scientific method is used to validate scientific theories.
Important Words You Need to Know:
Conclusion: – an answer to a question based on analyzing data and observations gathered in an experiment
Constants: things that the researcher keeps the same. This is important because the researcher is examining the effect of only the independent variable in the experiment
Control group: a standard of comparison
Data: recorded observations and measurements
Density: mass per unit volume of a substance, can be expressed as grams per ml or grams per cubic cm
Dependent variable: what the researcher observes or measures in the experiment, also called the responding variable
Experiment: a test designed to demonstrate the validity of a hypothesis
Hypothesis: an educated guess or prediction that can be tested by experiment or observation
Independent variable: what the researcher manipulates or purposefully changes
Law: a scientific rule that describes the behavior of natural phenomenon
Mass: the amount of matter in an object; measured in grams (g)
Results: – the data collected during an experiment expressed in paragraph form
Theory: a well-tested and widely accepted view that explains certain observable facts
Volume: amount of space occupied by a material or substance; measured in milliliters (ml) or cubic centimeters (cc)
Now You Try It!
Practice Questions: Circle the correct answer!
1. Which would be the BEST tools to measure the density of a small piece of copper ore?
A A barometer and a balance
B A density probe and a 250 ml beaker
C A metric ruler and a metal detector
D A graduated cylinder and a balance
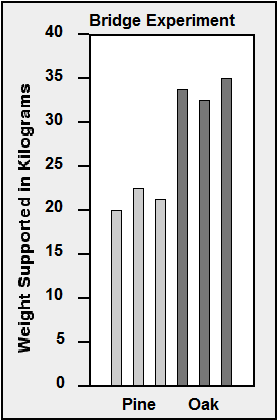
2. The graph below shows the relationship between mass and volume for three samples, A, B, and C, of a given material. What is the density of this material?
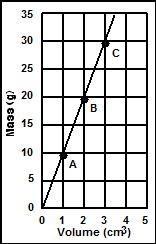
A 20.0 g/cm³
B 10.0 g/cm³
C 5.0 g/cm³
D 2.0 g/cm³
3. Students plan to use several rain gauges to compare average monthly rainfall on Virginia’s Coastal Plain and Piedmont regions. Which of these is the independent variable?
A Height of the rain gauge
B Brand of the rain gauge
C Size of the rain gauge
D Location of the rain gauge
4. A student claims that the full Moon occurs about once a month. What process will verify the student’s claim?
A Hypothesizing
B Theorizing
C Predicting
D Observing
5. Between which depths should the bedrock be mined in order to obtain rock with the highest percentage of copper?
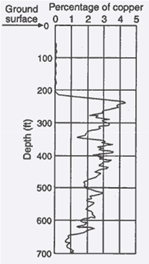
A 100-130 ft
B 230-260 ft
C 330-360 ft
D 650-680 ft
6. A student wanted to determine if building a wall would help stop beach erosion. He built one wall perpendicular from the beach, another parallel and a third in an outward bending arc. He then observed and collected data. In this experiment, what should be the “control”?
A the parallel wall
B the perpendicular wall
C the curved arc-shaped wall
D a section of beach with no wall
7. How much water is being measured in this graduated cylinder?
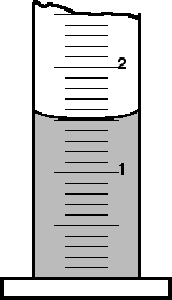
A 15 mL
B 1.5 mL
C 1.6 mL
D 2.5 mL
8. A graduated cylinder is used to find–
A volume
B mass
C length
D temperature
9. Which part of an experiment is the statement shown here?
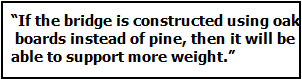
A problem
B procedure
C hypothesis
D results
10. The graph below illustrates the data from an experiment.
Does the data shown in this graph support or reject the statement shown in question 9?
A It supports the statement
B It rejects the statement
C It neither supports nor rejects the statement
Earth Science SOL Review Sheet #2 : Maps
Essential Knowledge and Skills
· Compare topographic maps of different scales.
· Construct a graph, table, chart, and/or diagram from data.
· Interpret graphs and diagrams.
· Read and interpret maps, including legends and lines (e. g., contour and isobar) used on maps.
· Locate points and directions on maps and globes using latitude and longitude.
· Construct profiles from topographic contours.
· Determine distance and elevation on a map.
· Identify a hilltop, stream, and valley on a topographic map.
Important Words You Need to Know:
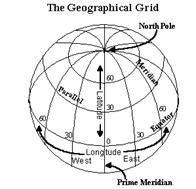
Latitude: the distance north or south of the equator, measured in degrees
Longitude: the distance east or west of the prime meridian, measured in degrees
Topographic Map: a map that represents Earth’s surface in three dimensions; it shows elevation, distance, directions, and slope
Bathymetric Map: a map that shows the ocean’s depth and can be used to study the topography of the ocean floor
Contour Line: a line on a topographic map that indicates (shows) elevation; every point on the line has the same elevation
Contour interval - the difference in elevation between two consecutive contour lines
Scale - a fixed ratio between the size of a real object and the size of a model of the same object
Elevation - height above sea level
Prime Meridian - meridian that runs through Greenwich, England; 0˚ longitude
GPS - Global Positioning System
North Pole - 90° north latitude
South Pole - 90° south latitude
Now You Try It!
Practice Questions: Circle the correct answer!
1. Which of the following maps or charts would show details of abyssal plains, seamounts, and ocean trenches?
A Topographic Map
B Weather Map
C Astronomical Chart
D Bathymetric Map
2. What is the latitude of location A?

A 0°
B 60°
C 90°
D 180°
3. What is the average gradient, in feet per mile, along the straight line from point A to point B?
![]()
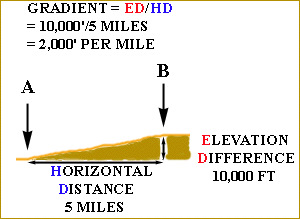
A 1000 ft/mile
B 1500 ft/mile
C 2000 ft/mile
D 2500 ft/mile
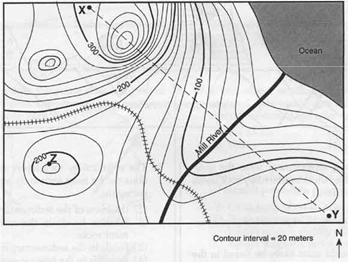
4. Which profile BEST shows the topography between points X and Y on this map?
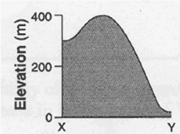
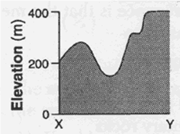
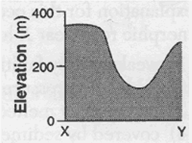
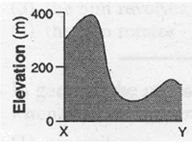 A B
A B
C D
5. Use the map shown above. Which of these could be the elevation of the tallest hill?
A 230 feet
B 390 feet
C 330 feet
D 420 feet
6. Use the map shown above. Mill River flows northeastward to the ocean. We know that because water always flows from high elevations towards lower elevations. How else could we tell the direction of flow?
A Contour lines bend uphill when they cross a river.
B All rivers flow northeastward.
C The river is located between to hills.
D All rivers flow away from the ocean
7. Your GPS unit gave your location as 14.5ºN, 49.5ºE. If you wanted to go to 10ºN, 45ºE, in which direction would you have to travel?
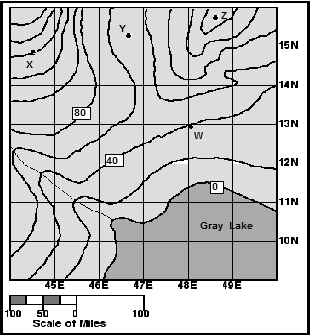
A Southwest
B Southeast
C Northeast
D Northwest
8. Use the map shown above. Which point is located in a valley?
A Point W
B Point X
C Point Y
D Point Z

|
Из за большого объема этот материал размещен на нескольких страницах:
1 2 3 4 5 6 7 |
