

Партнерка на США и Канаду по недвижимости, выплаты в крипто
- 30% recurring commission
- Выплаты в USDT
- Вывод каждую неделю
- Комиссия до 5 лет за каждого referral
In the decade to 2015, 59% of all bushfires in our landscape to which DELWP responded were caused by lightning. Accidental ignitions (mainly by machinery, escapes from campfires and private burn offs) caused 16% of bushfires, deliberate action by people 11%, and the remaining 14% had other or unknown causes.
On Severe, Extreme and Code Red fire danger days, bushfires can start and spread quickly to become major bushfires. Typically on such days, a strong north-westerly wind blows hot, dry air from central Australia across Victoria. If a bushfire ignites, or is already burning, this wind can push it rapidly south-east, creating a relatively narrow fire front and long fire flanks on its western and eastern sides. Then, an approaching cold front with a strong south-westerly wind can expand the bushfire’s eastern flank into a wide fire front, and intensify the fire. These weather conditions can create fast-moving bushfires and powerful convection columns, which in turn cause ember storms, wind-blown debris, downbursts, fire tornadoes and explosive balls of igniting eucalyptus vapour. In our landscape, these types of conditions resulted in the Mt Ray–Boundary Track and Goongerah-Deddick Trail (February 2014), Tostaree–Princes Highway (February 2011) and Churchill–Jeeralang (February 2009) bushfires.
Climate change is increasing bushfire risk in Victoria and lengthening the average fire season. Climate change projections indicate that Victoria is likely to have up to 70% more Severe, Extreme and Code Red days by 2050. We will also likely have:
· reduced average rainfall and streamflows
· fewer rainfall days (with heavier rainfall), and more consecutive dry days
· more frequent and widespread droughts
· more days over 35°C, and a higher annual mean temperature.
Climate change is also likely to alter the attributes and availability of habitat for the landscape’s plants and animals. This will magnify existing threats such as fragmentation (which isolates some species in particular areas) and loss of habitat (such as hollow-bearing trees). It may also increase the spread of some invasive species.
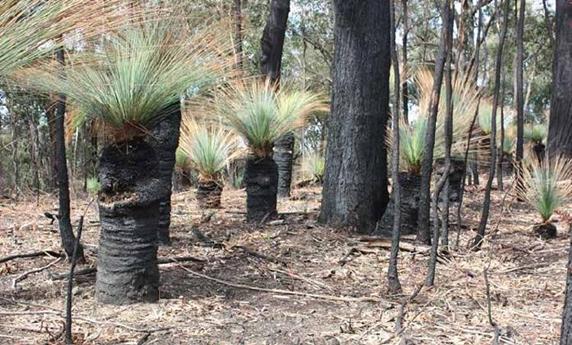
Picture caption: Grass trees in a fuel-reduced area © DELWP
Map 1 shows the landscape’s bushfire catchments. These are areas where the worst bushfires could start, spread and impact on priority communities and assets in a single day. These are important things to know because:
· at likely ignition points, we may conduct patrols on Severe, Extreme and Code Red fire danger days, and manage fuels (particularly if the spread or impact areas of these bushfires are difficult to treat)
· along spread paths, fuel management is the key to reducing the impact of major bushfires by reducing their spread and intensity
· managing fuel around and next to priority assets helps to minimise flame contact, radiant heat, ember generation and short-distance spotting potential. This fuel management can be difficult as it generally requires more resources and skills, and it may also rely on landowners making their properties as bushfire-safe as possible
· when a bushfire starts, we can use our knowledge of its likely spread paths and impacts to most effectively fight the fire, and provide information to communities that may be in
its path.
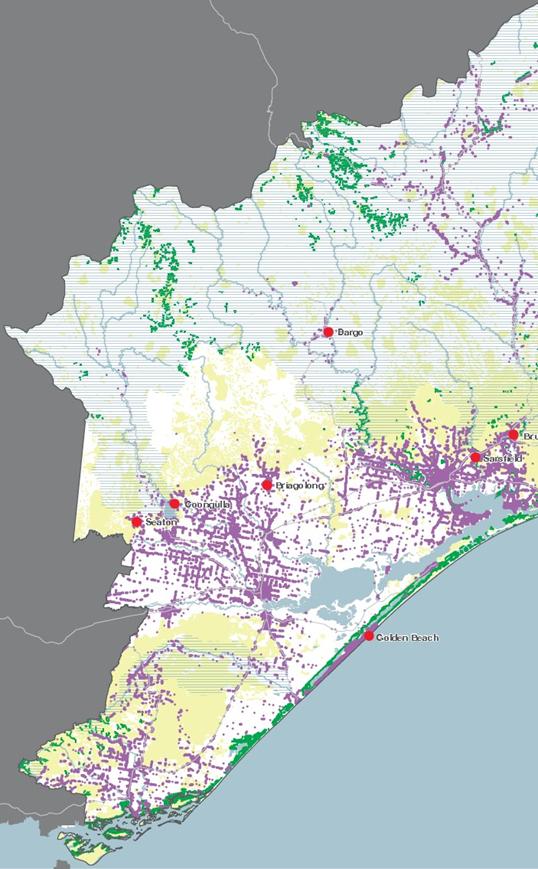
Map 1 shows where bushfire simulations predict bushfires that would cause maximum damage to property. These locations have relatively high numbers of properties, and are in the path of many simulated bushfires. The map shows the consequences of major bushfires are greatest when ignitions occur to the north-west of Bruthen, Nowa Nowa, Cann River and Mallacoota.
Map 1: Bushfire catchments and simulated property risk (western side of landscape)

Map 1: Bushfire catchments and simulated property risk (eastern side of the landscape)
Information relating to areas to the north of Omeo, the north-west of Dargo and north of Heyfield
These smaller, isolated bushfire catchments rank highly for risk. Bushfire catchments occupy only 20% of the landscape, but contribute 80% of its bushfire risk.
Information relating to the area to the north of Bairnsdale
A bushfire starting north-west of Bruthen and Bairnsdale could impact many communities and large numbers of scattered outlying properties. Economic assets (such as the tourism, timber and apiary industries), and environmental assets in these areas, are also vulnerable.
Information relating to areas to the west of Bonang
Our public land is largely uninterrupted forest and parks, much of it remote or difficult to mmer lightning storms can start dozens of bushfires that are difficult to suppress, leading to large landscape-scale bushfires that last for weeks or months.
Information relating to areas to the north-east of Cann River
Communities that are close to large areas of continuous forest are at high risk from a bushfire. In extreme weather conditions, a bushfire starting in a variety of locations far from these communities could potentially reach them in a single day.
What this plan prioritises for protection
How do we decide what to prioritise for protection?
Our planning method is based on the International Standard for Risk Management ISO 31000. The risk assessment process identifies categories of assets and values we consider important in our landscape—communities and properties, infrastructure, public administration, economic and environmental assets—and assesses the likelihood of impact by major bushfires, for a range of consequence levels. An asset category is at high risk from bushfires if:
· it is vulnerable to fire (that is, if fire will damage and/or disrupt it)
· it is likely to experience frequent bushfire impact with relatively minor consequences, or infrequent bushfire impact with relatively major consequences.
We prioritise an asset category for protection if it is at high risk from bushfires, and we can meaningfully mitigate bushfire risk to it through our fuel management strategy. We consider all assets within each priority asset category as priority assets, regardless of where they are in the landscape. We use the PIPE$S categories identified in the code of practice: People, Infrastructure, Public Administration, Environment, Economy and Social Settings.
We identified priorities for protection and developed our fuel management strategy in partnership with emergency service agencies and stakeholders from across our community (including the Internal Working Group and Landscape Reference Group), which determined the priority areas for bushfire management, using a risk mitigation framework.
Our planning method draws on the best available information from data and community consultation. We use the Victorian Fire Risk Register and information from Office of the Emergency Management Commissioner, DELWP, VicForests, PV and Aboriginal Affairs Victoria.
We use PHOENIX RapidFire bushfire simulation software, which is world-leading technology developed by The University of Melbourne and the Bushfire and Natural Hazards Co-operative Research Centre, in conjunction with DELWP. PHOENIX RapidFire simulates how bushfires spread from a grid of ignition points across the landscape, given:
· terrain and fuel (being a result of any location’s fire history, type of vegetation and modelled fuel accumulation) at the starting point and along spread paths
· weather conditions.
Victorian Bushfire Risk Profiles provides more information about how DELWP uses PHOENIX RapidFire to quantify risk.
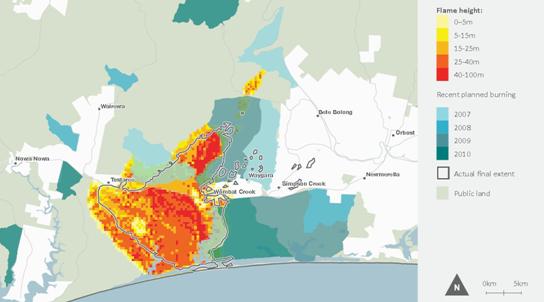
Map 2 compares PHOENIX RapidFire’s bushfire simulation to the actual extent of the 2011 Tostaree bushfire. It shows that firefighters kept the final fire to very close to the simulated extent after 24 hours, particularly in the north-east sector, where the fire was substantially slowed by recent planned burning, and posed the greatest threat to communities. The differences between the simulated and actual extents were mostly due to local fire dynamics (fuel, weather and topographical variations) for which the simulation could not fully account. The map shows simulated flame heights (indicating fire intensity) which closely matched post-fire severity mapping. The map also shows recent nearby planned burning, which substantially slowed both the simulated and actual fires. This helped us stop the fire from spreading further east, south of the Princes Highway, and slowed its spread to suppressible levels north of the highway.
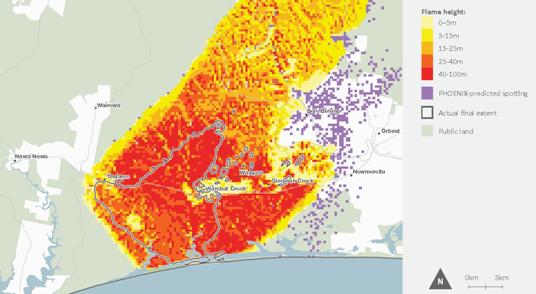
Map 3 compares the extent of the 2011 Tostaree bushfire with the extent simulation without planned burning since 2006. It shows that if no planned burning had been undertaken, the simulated bushfire could have grown to three times its size, increasing the likelihood and consequence of the bushfire impacting communities to the west and north of Orbost.
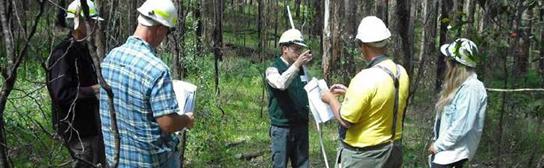
Picture caption: A community field day © DELWP
Map 2: Actual and simulated extent of 2011 Tostaree bushfire
Map 3: Actual and simulated (without planned burning) extent of 2011 Tostaree bushfire
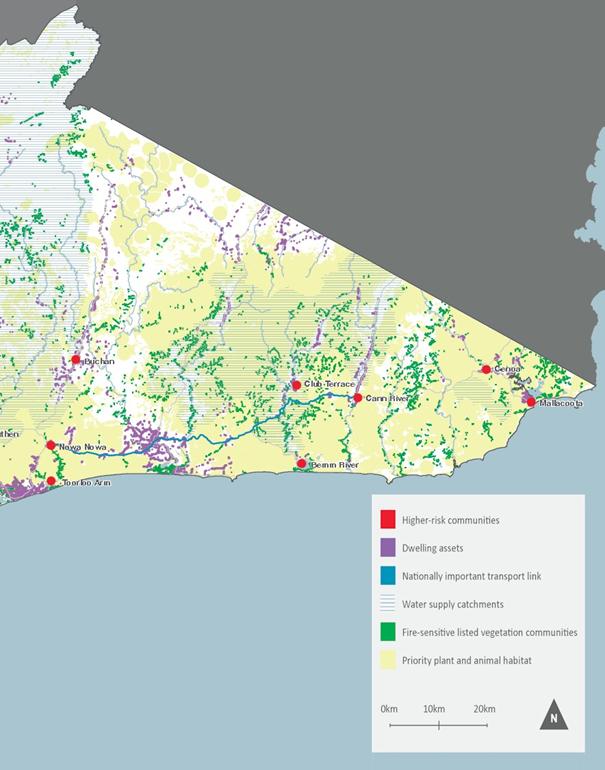
Map 4: Five of our landscape’s priority asset categories (western side of landscape)
Map 4: Five of our landscape’s priority asset categories (eastern side of landscape)

|
Из за большого объема этот материал размещен на нескольких страницах:
1 2 3 4 5 6 |
