

Партнерка на США и Канаду по недвижимости, выплаты в крипто
- 30% recurring commission
- Выплаты в USDT
- Вывод каждую неделю
- Комиссия до 5 лет за каждого referral
Equity capital as of December 31, 2012 includes the capital surplus (RUB11,563,225,000, 16%), authorized capital (RUB23,511,884,000, 32.6%) and undistributed profit (uncovered loss) (- RUB715,974,000, -1%).
Other liabilities amount to less than 5% of the equity capital.
Liabilities of the Company for the analyzed period increased by RUB6,028,025,%) and amounted to RUB37,449,932,000
Long-term loans decreased by RUB4,979,650,000 and amounted to RUB14,471,%), short-term loans increased by RUB11,007,675,000 and amounted to RUB22,978,%), short-term payables decreased by RUB4,508,253 and amounted to RUB4,838,%) as of the end of the reporting period.
Other liabilities amount to less than 5% of the Company’s liabilities.
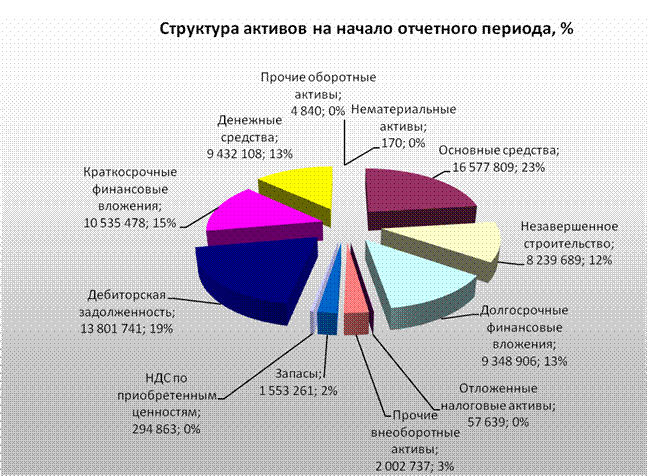
Структура активов на начало отчетного периода, % | Incoming Assets, % |
Прочие оборотные активы; 4 840; 0% | Other capital assets; 4,840; 0% |
Денежные средства; 9 432 108; 13% | Cash; 9,432,108; 13% |
Краткосрочные финансовые вложения; 10 535 478; 15% | Short-term financial investments; 10,535,478; 15% |
Дебиторская задолженность; 13 801 741; 19% | Receivables; 13,801,741; 19% |
НДС по приобретенным ценностям; 294 863; 0% | VAT on assets purchased; 294,863; 0% |
Запасы; 1 553 261; 2% | Inventory; 1,553,261; 2% |
Прочие внеоборотные активы; 2 002 737; 3% | Other current assets; 2 002 737; 3% |
Отложенные налоговые активы; 57 639; 0% | Deferred tax assets; 57 639; 0% |
Долгосрочные финансовые вложения; 9 348 906; 13% | Long-term financial investments; 9,348,906; 13% |
Незавершенное строительство; 8 239 689; 12% | Construction in progress; 8,239,689; 12% |
Основные средства; 16 577 809; 23% | Fixed assets; 16,577,809; 23% |
Нематериальные активы; 170; 0% | Intangible assets; 170; 0% |
Стуктура активов на конец отчетного периода, % | Closing Assets, % |
Денежные средства; 6 386 728; 9% | Cash; 6,386,728; 9% |
Краткосрочные финансовые вложения; 323 646; 0% | Short-term financial investments; 323,646; 0% |
Дебиторская задолженность; 13 572 573; 19% | Receivables; 13,572,573; 19% |
НДС по приобретенным ценностям; 155 379; 0% | VAT on assets purchased; 155,379; 0% |
Запасы; 1 669 700; 2% | Inventory; 1,669,700; 2% |
Прочие внеоборотные активы; 2 976 016; 4% | Other current assets; 2,976,016; 4% |
Отложенные налоговые активы; 1 099 105; 2% | Deferred tax assets; 1,099,105; 2% |
Долгосрочные финансовые вложения; 19 275 035; 27% | Lomg-term financial investments; 19,275,035; 27% |
Незавершенноt строительство; 10 119 683; 14% | Construction in progress; 10,119,683; 14% |
Основные средства; 16 612 196; 23% | Fixed assets; 16,612,196; 23% |
Нематериальные активы; 291; 0% | Intangible assets; 291; 0% |
Прочие оборотные активы; 4 683; 0% | Other capital assets; 4 683; 0% |
Структура пассивов на начало отчетного периода, % | Incoming Liabilities, % |
Кредиторская задолженность; 9 347 240; 13% | Payables; 9,347,240; 13% |
Краткосрочные займы и кредиты; 2 325 894; 4% | Short-term loans; 2,325,894; 4% |
Отложенные налоговые обязательства; 1 498 492; 2% | Deferred tax liabilities; 1,498,492; 2% |
Долгосрочные займы и кредиты; 17 952 556; 25% | Long-term loans; 17,952,556; 25% |
Нераспределенная прибыль (непокрытый убыток); 4 990 128; 7% | Undistributed profit (uncovered loss); 4,990,128; 7% |
Добавочный капитал; 11 563 317; 16% | Surplus capital; 11,563,317; 16% |
Уставный капитал; 23 511 884; 33% | Authorized capital; 23 511 884; 33% |
Структура пассивов на конец отчетного периода, % | Closing Liabilities, % |
Кредиторская задолженность; 4 838 987; 7% | Payables; 4,838,987; 7% |
Краткосрочные займы и кредиты; 17 766 380; 24% | Short-term loans; 17,766,380; 24% |
Отложенные налоговые обязательства; 1 826 591; 3% | Deferred tax liabilities; 1,826,591; 3% |
Долгосрочные займы и кредиты; 12 593 926; 17% | Long-term loans; 12,593,926; 17% |
Нераспределенная прибыль (непокрытый убыток); -715 974; 1% | Undistributed profit (uncovered loss); -715,974; 1% |
Добавочный капитал; 11 ; 16% | Surplus capital; 11,563,225; 16% |
Уставный капитал; 23 511 884; 32% | Authorized capital; 23 511 884; 32% |
Analysis of Change of Net Asset Value of the Company
Table 5.2.3.
Indicator | Calculation formula | As of December 31, 2009 | As of December 31, 2010 | As of December 31, 2011 | Variability, (+,-) |
Net asset value, ‘000 RUB | Line (1110+1130+1150+1160+1170+1210+1220+1230+1240+1250+1260), F.1 – Line (1410+1420+1430+1450+1510+1520+1540+1550), F.1 | 39,952,760 | 40,427,289 | 34,745,037 | -5,682,252 |
Net assets/authorized capital ratio | Net assets value / Line 1310, F.1 | 1.70 | 1.72 | 1.48 | -0.24 |
Net asset turnover (turnover) | Line 2110, F.2 / Net assets value | 1.02 | 1.14 | 1.37 | 0.23 |
Return on net assets, % | Line 2400, F.2 / Net assets value | 10.55% | 1.17% | - |
Net assets value for the reporting period decreased by RUB5,682,252,000 as compared to 2010 due to loss gained in 2011 and amounted to RUB34,745,037,000
Net assets/authorized capital ratio as of December 31, 2011 is positive and amounts to 1.48. Therefore, the Company meets the minimal financial stability requirement as the value of net assets exceed the authorized capital amount by RUB11,233,153,000 or 48%.
Net asset turnover is positive. The higher the net assets turnover of the Company is, the faster net assets are converted into profit, i. e. the better they are used. The closing net assets turnover increased by 0.23 points as compared to 2010 and amounted to 1.37.
Analysis of the Company’s performance
Liquidity ratios
Table 5.2.4.
Indicator | Calculation formula | Optimum value | As of December 31, 2009 | As of December 31, 2010 | As of December 31, 2011 |
Cash ratio | F.1, Line (1240+1250) / F.1, Line (1520+1510) | >0.2-0.5 | 1.24 | 1.71 | 0.30 |
Quick assets ratio | F.1, Line (1231+1235+1240+1250) / F.1, Line (1510+1520) | >0.8 | 2.14 | 2.89 | 0.90 |
Current liquidity ratio | F.1, Line () / F.1, Line (540) | >1.5 | 2.26 | 2.89 | 0.89 |
Cash ratio shows the part of short-term liabilities the company is able to cover out of available marketable cash and short-term financial investments (if necessary).
In 2011 the Cash Ratio amounted to 0.3 which is within the Optimum Value (0.2-0.5).
Quick assets ratio shows current liabilities the company is able to cover both out of available cash and estimated income for works or services provided. This Ratio reflects the anticipated credit standing of the company in case of timely receivables repayment. Quick assets ratio as of December 31, 2011 amounted to 0.9 which is higher than the Optimum Value (0.8).
Current liquidity ratio shows short-term liabilities the company is able to cover out of available cash, short-term financial investments, short-term receivables and inventory sales. This Ratio reflects the company’s ability to pay its current liabilities during the normal course of operations. Current liquidity ratio as of December 31, 2011 amounted to 0.89.
Cash and Quick Assets Ratios of the Company for the reporting period exceed the Optimum Values, thus indicating the sufficient liquidity level of the Company. Current Liquidity Ratio is lower than the Optimum Value due to increased short-term liabilities.
Profitability
Table 5.2.5.
Indicator | Calculation formula | As of December 31, 2009 | As of December 31, 2010 | As of December 31, 2011 |
Return on assets (ROA), % | Line 2400, F.2/ 0,5*( Line 1600beg+Line 1600end), F.1 | 7.3% | 0.7% | - |
Return on total assets (ROTA), % | Line 2300 ф.2 / 0,5*(Line 1600beg+Line 1600end), F.1 | 9.5% | 1.4% | - |
Return on equity (ROE), % | Line 2400, F.2 / (Line 1300), F.1 | 10.5% | 1.2% | - |
Return on sales (ROS), % | Line 2200, F.2 / Line 2110, F.2 | 15.5% | 5.8% | 2.2% |
It is not possible to calculate the return on assets and equity as of December 31, 2011 due to losses of the Company gained in 2011.

|
Из за большого объема этот материал размещен на нескольких страницах:
1 2 3 4 5 6 7 8 9 10 11 12 13 14 |
