

Партнерка на США и Канаду по недвижимости, выплаты в крипто
- 30% recurring commission
- Выплаты в USDT
- Вывод каждую неделю
- Комиссия до 5 лет за каждого referral
Return on sales is the sales profit/turnover ratio reflecting the sales profit to be earned by the Company per each ruble earned from sales of production. Return on sales of the Company as of the end of reporting year amounts to 2.2 % , i. e. per each 100 rubles earned the Company received 2.2 rubles of sales profit.
Financial stability
Table 5.2.6.
Indicator | Calculation formula | Optimum value | As of December 31, 2009 | As of December 31, 2010 | As of December 31, 2011 |
Equity to total assets ratio | Line (1300+1530), F.1 / Line 1700, F.1 | 0.5-0.8 | 0.65 | 0.57 | 0.51 |
Financing ratio | Line 1300, F.1 / Line (1400+1500), F.1 | >0.7 | 1.82 | 1.29 | 0.93 |
Financial stability ratio | Line (1300+1400), F.1/ Line 1700, F.1 | >0.6 | 0.74 | 0.83 | 0.68 |
Receivables to payables ratio | Line (1231+1235), F.1/ Line 1520, F.1 | >1.0 | 2.73 | 1.48 | 2.80 |
Equity to total assets ratio shows the equity to total capital (assets) ratio. It reflects the company’s independence from its creditors. As of the end of 2011 the equity to total assets ratio amounts to 0.51 which is within the Optimum Value (0.5-0.8).
Financing ratio shows the part of the company’s activities financed out of its equity capital and the one financed out of borrowed funds. As of December 31, 2011 the financing ratio amounts to 0.93 which is higher than the minimum allowed value (0.7).
Financial stability ratio as of the end of 2011 is within the Optimum Value range (0.68 > 0.6) and shows the sufficient financial stability level of the Company.
Efficiency indicators
Table 5.2.7.
Indicator | Calculation formula | As of December 31, 2009 | As of December 31, 2010 | As of December 31, 2011 |
Receivables turnover ratio, turnovers | Line 2110, F.2 / (0,5*(Line 1231beg+Line 1231 end+Line 1235beg+Line 1235 end)), F.1 | 3.69 | 3.29 | 3.47 |
Period of clearing the receivables, days | ND / RTR, where ND is the number of days in period | 99 | 111 | 105 |
Payables turnover ratio, turnovers | Line 2110, F.2 / (0,5*(Line 1520beg+Line 1520end)), F.1 | 8.16 | 6.33 | 6.69 |
Period of clearing the payables, days | ND / PTR, where ND is the number of days in period | 45 | 58 | 55 |
Turnover indicators determine the debt repayment risk. The higher the turnover indicator, the faster the receivables and payables are repaid. The longer the repayment period, the higher the risk receivables and payables repayment risk.
In 2011, the receivables repayment period was 105 days and it is 6 days less than the clearing period in 2010, thus showing the improvement of receivables performance.
In 2011 the payables repayment period was 55 days and it is 3 days less as compared to 2010.
5.3. Distribution of Profit for the Past Three Years.
Profit distribution from 2008 to 2010
Table 5.3.1.
Unit: ‘000 RUB
2008 | 2009 | 2010 | |
Undistributed profit (loss) for the reporting period: | 45,994 | 4,214,856 | 476,105 |
To be distributed to: | |||
Reserve capital | 39,832 | 210,743 | 23,805 |
Accumulation fund | 6,162 | - | - |
Dividends | - | - | - |
Uncovered loss of past years | - | - | - |
Undistributed profit | - | 4,004,113 | 452,300 |
6. INVESTMENT ACTIVITY
6.1. Investments of the Company
Amount and structure of capital expenditures for 2011
One of the priorities of implementing the Investment Program in 2011 was the implementation of sustainable solutions in OJSC TGC-9 companies while preserving the sufficient level of investments to reliability improvement of operational equipment.
In 2011 OJSC TGC-9 invested RUB4,372,791,000, excluding VAT. These included modernization and reconstruction investments amounted to RUB1,563,390,000, excluding VAT, development and new construction investments amounted to RUB2,809,400,000, excluding VAT. The Company commissioned and certified by Commissioning Certificates fixed assets amounting to RUB1,998,500,000.
Capital expenditures structure of the 2011 Investment Program, ‘000 RUB, net of VAT:
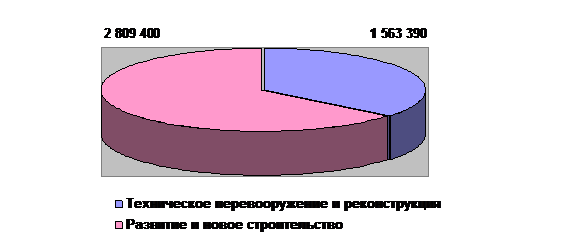 |
Tехническое перевооружение и реконструкция | Modernization and reconstruction |
Развитие и новое строительство | Development and new construction |
Structure of capital expenditures under the 2011 Modernization and Reconstruction Plan:
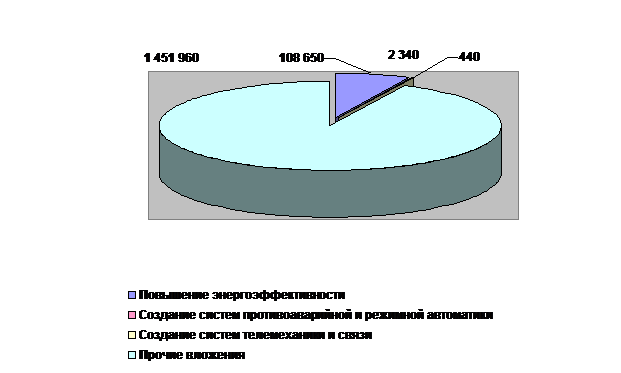 |
Повышение энергоэффективности | Energy efficiency level improvement |
Создание систем противоаварийной и режимной автоматики | Emergency and profile control systems development |
Создание систем телемеханики и связи | Supervisory control and telecommunication systems development |
Прочие вложения | Other expenditures |
Sources of financing of the 2011 Investment Program:
‘000,000 RUB
Item No. | Source of Financing | Amount, 2011 | |
Total | |||
Planned* | Actual** | ||
1 | Equity capital | 12,614.63 | 5,122.09 |
1.1. | Invested profit: | 207.44 | |
1.1.1. | including investment component in tariffs | 207.44 | |
1.1.2. | including the profit from the commercial sector | ||
1.1.3. | including from technological connection (for grid companies) | ||
1.1.3.1. | including from the technological connection of generating companies | ||
1.1.3.2. | including from the technological connection of consumers | ||
1.1.4. | Other profit | ||
1.2. | Depreciation | 2,042.14 | 1,380.22 |
1.2.1. | Depreciation included in the tariff | 2,042.14 | 1,380.22 |
1.2.2. | Other depreciation | ||
1.2.3. | Underutilized depreciation of past years | ||
1.3. | VAT recovery | ||
1.4. | Other equity capital | 10,572.48 | 3,544.68 |
1.4.1. | including additional issue | 10,572.48 | 3,443.20 |
1.5. | Incoming equity balance | ||
2. | Borrowed funds, including: | 7,006.58 | 361.36 |
2.1. | Loans | 7,006.58 | 361.36 |
2.2. | Funded loans | ||
2.3. | Loans from organizations | ||
2.4. | Budgetary financing | ||
2.5. | External investors funds | ||
2.6. | |||
2.7. | Other borrowed funds | ||
TOTAL sources of financing | 19,621.20 | 5,483.45 | |
For WGC/TGC, including | |||
Under PSA | 17,579.06 | 3,895.79 | |
Without PSA | 2,042.14 | 1,587.66 |
Key activities under the 2011 M&R Program of OJSC TGC-9:

|
Из за большого объема этот материал размещен на нескольких страницах:
1 2 3 4 5 6 7 8 9 10 11 12 13 14 |
