
Партнерка на США и Канаду по недвижимости, выплаты в крипто
- 30% recurring commission
- Выплаты в USDT
- Вывод каждую неделю
- Комиссия до 5 лет за каждого referral
Figure 7 – Percentage of households with access to DSL, Cable and Wireless
Figure 8 – Percentage of businesses with access to broadband technologies
Figure 9 – Percentage of businesses with access to DSL, Cable or Wireless technologies
Figure 10 – Percentage of rural telephone subscribers with access to broadband technologies
Figure 11 – Major barriers to broadband access deployment
Figure 12 – Major cost issues limiting the spread of broadband
Figure 13 – Scale of difficulty for financing broadband services
Figure 14 – Average speed of downstream data for DSL
Figure 15 – Average speed of downstream data for Cable
Figure 16 – Average speed of downstream data for wireless based services
Figure 17 – Fastest growing broadband technologies
Figure 18 – Application categories that broadband is used for.
Introduction
In March, 2003, a questionnaire was distributed by ITU‑D circular letter CA/25 following the Rapporteur’s Group meeting for Question 20/2: Examination of access technologies for broadband communications questionnaire on march 3rd 2003 (see appendix of Annex 2). The questionnaire requested Member States, Sector Members, relevant organizations and industry to identify relevant wireless and wireline broadband access technologies and their attributes. The questionnaire also aimed to identify economic, technical and development factors influencing the effective deployment and accessibility of broadband access technologies and applications. This report represents the summarized results of the responses received by the ITU by June 2003.
By mid June 2003 fifty-five responses were received from forty-nine countries from the five ITU regions. Table 1, below gives a list of countries and indicates using parenthesis which countries responded with more than once.
Table 1 – Respondent Countries | ||||
Africa | Americas | Asia‑Pacific | Arab States | Europe |
Chad | Barbados | Israel (2) | Egypt | Armenia |
Cфte d'Ivoire (2) | Bolivia | Japan (2) | United Arab Emirates | Belarus |
Ethiopia | Brazil | Korea (Rep.) | Belgium | |
Malawi | Canada | Maldives | Bosnia | |
Mauritius | Chile | Myanmar | Bulgaria | |
Nigeria | Costa Rica | Nepal | Denmark | |
South Africa | Dominican Rep. | Pakistan | Estonia | |
Uganda | Ecuador | Philippines (3) | Hungary | |
Guyana | Sri Lanka | Lithuania | ||
Honduras | Thailand | Malta | ||
Mexico | Tonga | Norway | ||
China | Poland | |||
India | Portugal | |||
Spain | ||||
Switzerland (2) |
Methodology
In terms of workflow, MySql Server was used as a data repository for questionnaire responses and ToolMagic’s MySQL Tools along with Microsoft Access were used to extract and summarise data with Microsoft Excel being used for graph generation and numeric analysis and the final report written in Microsoft Word.
This report follows the overall structure of the questionnaire and summarises the findings as reported by questionnaire respondents. For the purpose of this report where more than one response for a member state was received, the data was merged during data analysis for the given territory where appropriate or in the case of conflicting information, data supplied with verifiable cited data sources, was selected. As a result, for the purpose of this report, the term respondent is used to indicate the information provided by a responding territory, rather than the individual responding organization.
Where provided data seemingly in response to ambiguity or misinterpretation of a given question is noted in the report text in order to facilitate discussion during the relevant Study Group meeting.
Technology
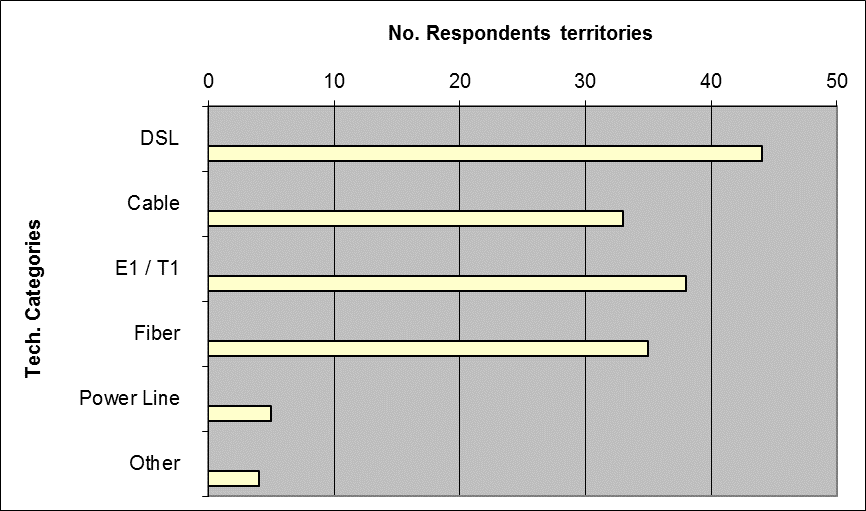
The technology section of the questionnaire aimed to discover which broadband technologies are in use to deliver broadband-based services. As can be clearly seen from Figure 1 below, the current dominant technology for delivering broadband services over wire line networks is DSL, closely followed by more traditional E1/T1 (E1 interface provides a 2 048 kbit/s access rate, T1 interface provides a 1 544 kbit/s access rate, see also ITU‑T Recommendations G.703 and G.704 Interface for WAN analysis), fibre and cable connections.
Figure 1 – Wireline Technologies utilized to provide broadband services
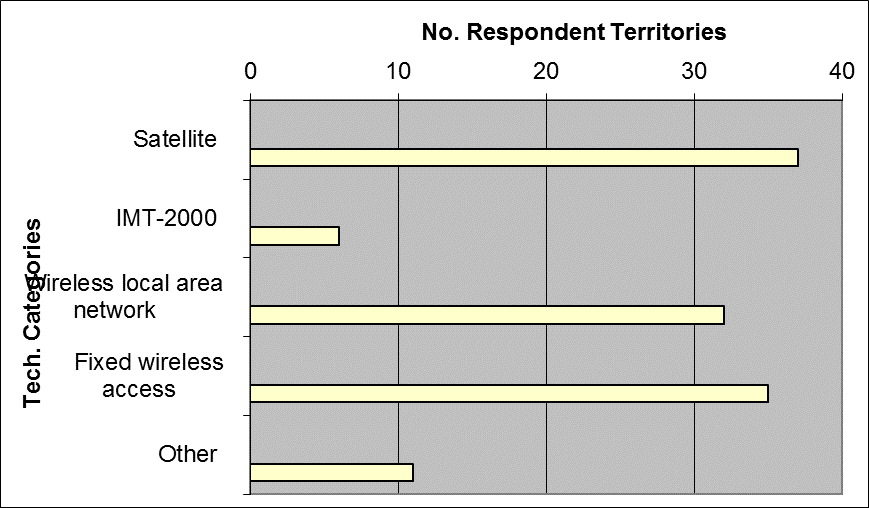
Wireless technologies are widely used to deliver broadband services in developing countries with satellite, fixed wireless and wireless local area networks are used to overcome barriers where wireline solutions are inappropriate, as indicated in Figure 2 below:
Figure 2 – Wireless technologies utilized to provide broadband services
A number of countries employed technology solutions other than DSL, Cable, E1/T1, fibre and power line for wireline based solutions to deliver broadband services. Other technologies used in delivering wireline solutions included ISDN, ATM.
For alternates to the main wireless technologies of satellite, IMT-2000 or wireless LAN some respondents were using developments such as laser free space optics used in both South Africa and Canada, general packet radio service (GPRS) in Estonia and spread spectrum solutions in Ecuador. Table 2, provides a summary of the other technologies reported by questionnaire respondents:
Table 2 – Other technologies employed by respondent countries to deliver broadband service
Country | WIRELESS_OTHER_DESC |
Armenia | 802.11b Radio Ethernet |
Belarus | GPRS, IMT-MC-450 |
Bolivia | MMDS (Multipoint multi-channel distribution systems), LMDS (local multipoint distribution systems) |
Brazil | Multipoint multi-channel distribution systems (MMDS) are currently used and local multipoint distribution systems are in network roll out focused on the delivery of broadband services. |
Canada | Optional Free Space (Laser), used by companies in some urban centres. |
Ecuador | Spread Spectrum (A communication technique that spreads a signal bandwidth over a wide range of frequencies for transmission and then de-spreads it to the original data bandwidth at the receiver.) |
Estonia | GPRS |
Ethiopia | Fibre based access in Addis Ababa and major Cities |
Korea (Rep.) | CDMA 1X (according to our, Korean, definition, it belongs to 2.5G and not to 3G IMT‑2000) |
South Africa | Free Space Optics (Laser) |
Sri Lanka | Point to point Microware |
Competition
The competition section of the questionnaire aimed to assess the degree of competition for Internet services, in local loop provision, among different broadband technologies and how many operators offer high speed internet, DSL, cable, wireless, etc.
Of the respondent countries only four countries did not permit competition in Internet services, namely:
Ethiopia, Costa Rica, the Philippines and the United Arab Emirates.
As shown in Table 3, twenty-eight of the respondent countries have competition in the local loop.
Table 3 – Respondent countries with competition in local loop
• Chad | • Japan |
• Nigeria | • Korea (Rep.) |
• South Africa | • Myanmar |
• Uganda | • Sri Lanka |
• Bolivia | • Thailand |
• Brazil | • Tonga |
• Canada | • Belgium |
• Chile | • Bulgaria |
• Dominican Rep. | • Denmark |
• Ecuador | • Malta |
• Guyana | • Norway |
• Mexico | • Portugal |
• China | • Spain |
• India | • Switzerland |
While as shown in Table 4, the following twenty one countries do not:

|
Из за большого объема этот материал размещен на нескольких страницах:
1 2 3 4 5 6 7 8 9 10 11 12 13 14 15 16 17 18 19 20 21 22 23 24 25 26 27 28 29 30 31 32 33 34 35 36 37 38 39 40 41 42 43 44 45 46 47 48 49 |
