
Партнерка на США и Канаду по недвижимости, выплаты в крипто
- 30% recurring commission
- Выплаты в USDT
- Вывод каждую неделю
- Комиссия до 5 лет за каждого referral
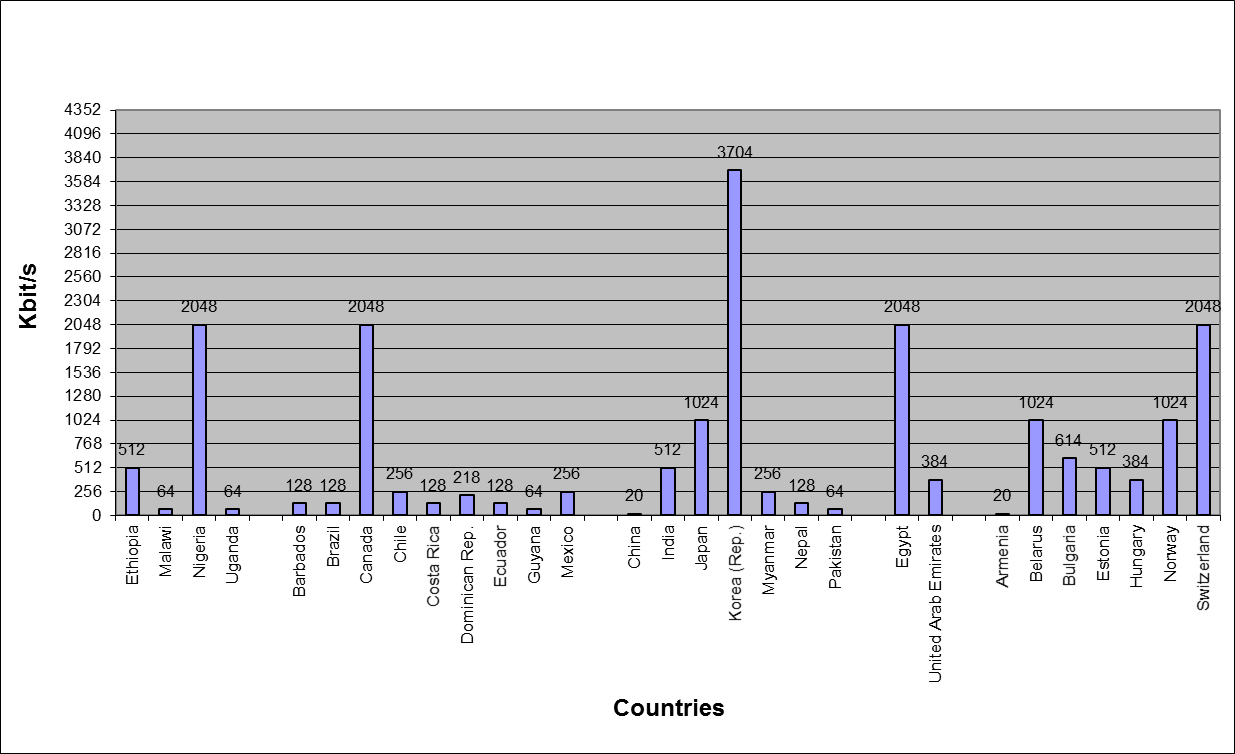
In the questionnaire the quality of service section sought to establish the average speeds of downstream data for DSL, cable, wireless and other technologies employed to deliver broadband services. In most cases responses gave a range of speeds e. g. DSL may vary from 384 kbit/s downstream for residential and 512 for business. In some cases the reasons for the different capacities stated were not provided or were not clear given the mixed usage-pricing models that are used in differing countries. As a result the lowest average speed indicated was used for the graphs and purposes of comparisons. This means that in the case of some countries such as Japan the average downstream speed is shown as 2 Mbit/s rather than the 10 to 1 000 Mbit/s that is available over specialist fibre networks available to businesses. For the purposes of the graphs, the respondent countries are alphabetically grouped in terms of their ITU regional groupings of Africa, Americas, Arab States, Asia‑Pacific and Europe.
In addition to DSL, cable and wireless a number of other technologies are used to deliver downstream broadband services. In Ethiopia the school-net, health-net, gov-net services and a DDN service that supports dedicated, and frame relay service connection for Internet access and enterprise wide LAN, etc offers speed up to 45 Mbit/s. In Barbados fixed wireless connections are used to deliver speeds of 128 kbit/s and a number of countries use satellite-based services – in Canada these offer access speeds of 500 kbit/s, while in Myanmar broadband satellite (IPSTAR) offers connection speeds up to 1 218 kbit/s. In Estonia general packet radio services (GPRS) are used to deliver connection speeds of the 30 kbit/s. Finally fibre is used in a Japan (up to 100 Mbit/s for FFTH), 10 Mbit/s in Norway and 2 Mbit/s in Egypt. The following graphs illustrate the average downstream data for DSL, Cable and wireless based broadband services at an average distance of two to four kilometers.
Figure 14 – Average speed of downstream data for DSL
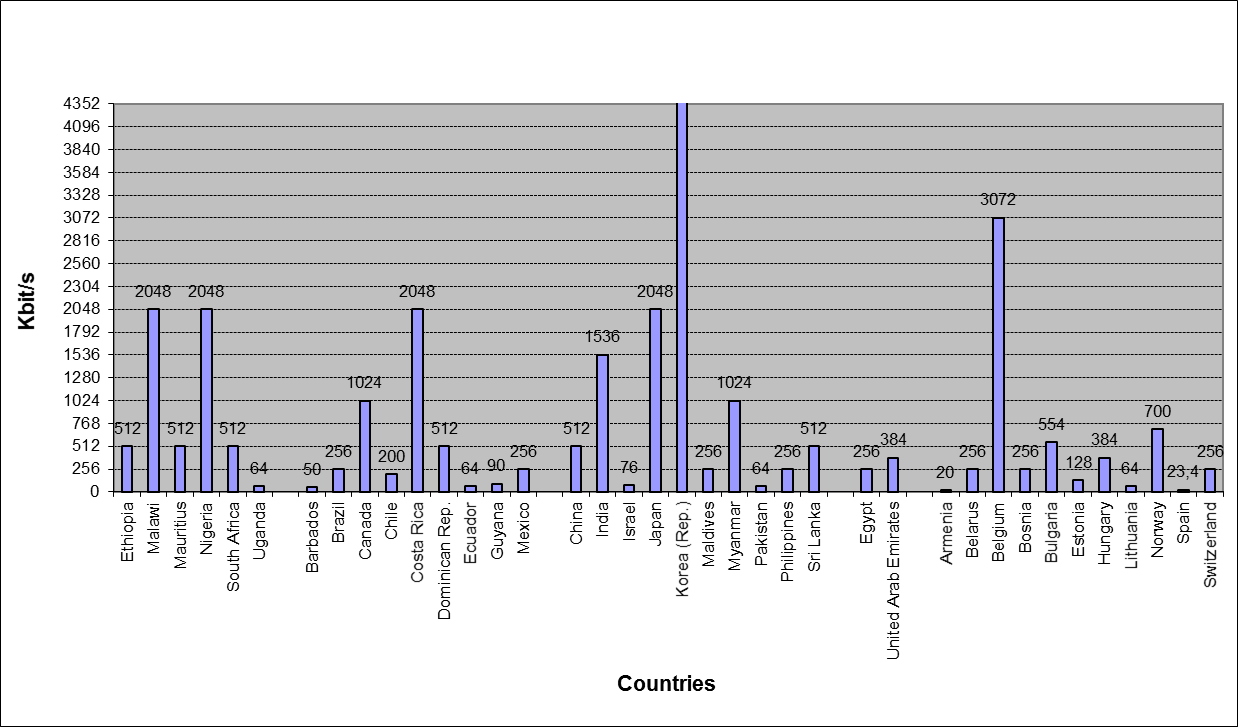
Figure 15 – Average speed of downstream data for Cable
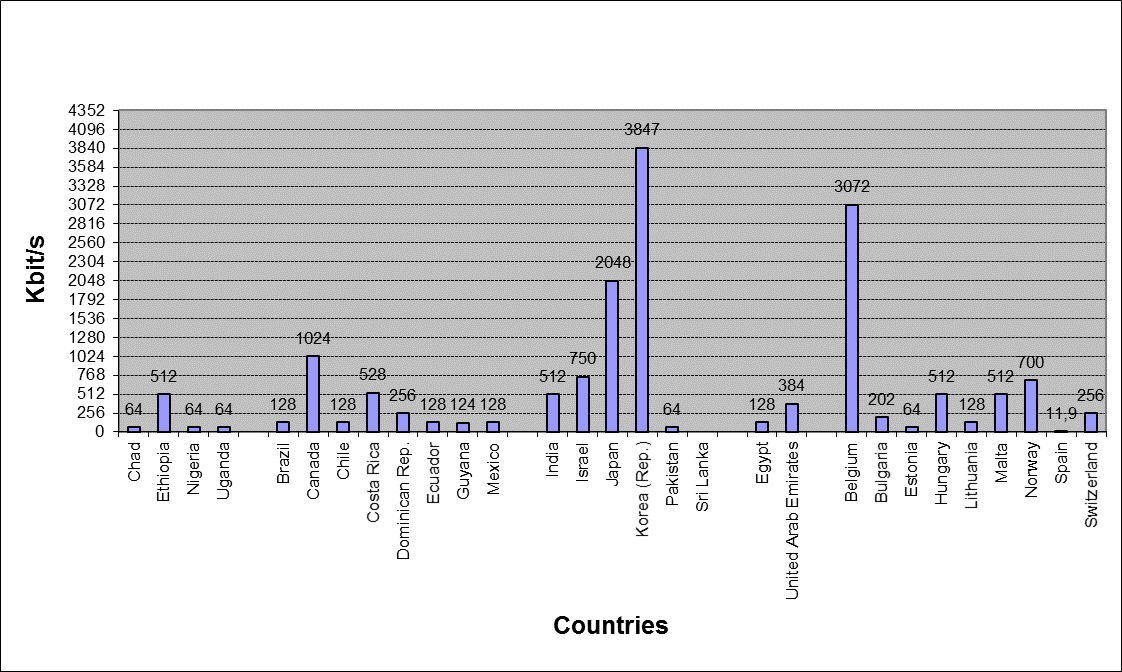
Figure 16 – Average speed of downstream data for wireless based services
Miscellaneous
The miscellaneous section of the questionnaire sought information on public access points to broadband services, fastest growing broadband technologies and those applications areas that broadband services are being used for. Seventeen respondent countries offered free access to broadband services through public centres such schools, libraries, hospitals, government office buildings and telecentres etc. These countries are:
• Cфte d’Ivoire • Canada • Chile • Dominican Rep. • Israel • Japan • Korea (Rep.) • Myanmar | • Belgium • Denmark • Hungary • Lithuania • Malta • Norway • Poland • Spain • Switzerland |
A further seven countries offered access to broadband services through public centres via a special pricing agreement, these were:
• Nigeria
• Uganda
• China
• Maldives
• Thailand
• Tonga
• Belarus
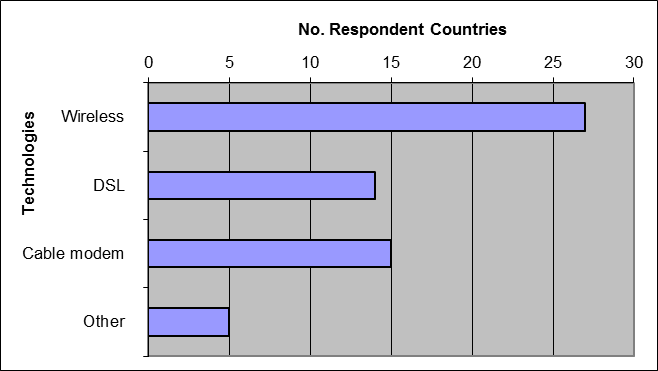
Finally Guyana, Sri Lanka, Armenia and Estonia offered access to broadband services through public centres but at standard market prices. The fastest growing broadband technology identified by respondents (as shown in the following graph) was wireless. A number of countries such as Belarus, Estonia, Ethiopia and the Philippines selected more than technology and reflects their current marketplace, in that no one technology has reached a dominant market position or serves diverse needs.
Figure 17 – Fastest growing broadband technologies
Broadband-based services are used in a number of application areas, with the main drivers being business (for accessing email, corporate intranets etc) and personal information access (web browsing, downloading music and multimedia etc). When examining the regional basis for these applications – the proportions are roughly the same business use is the primary driver in both developed and developing countries, while personal use is also a major driver for broadband services in both developed and developing countries. The respondent countries that were exceptions to this were Malawi, Guyana, Honduras, Nepal, Thailand, Armenia, Bosnia where business applications were the sole main application driver.
Figure 18 – Application categories that broadband is used for
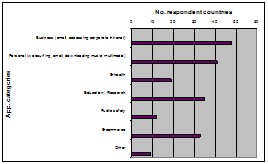
In Nigeria, Canada, and Demark E - government services were identified as other application areas for broadband services; Whilst Japan and Korea both mentioned IP telephony applications being used and Korea also identified both games and video on demand as the basis for entertainment applications.
ANNEX VI
Broadband Questionnaire
DEADLINE FOR THE REPLIES: 30 May 2003
Given Name |
Family Name |
Your Title |
Organization / Main activity |
Telephone/Fax (with area code) |
Country |
City |
Business Address |
Any queries or requests for further information regarding this questionnaire should be addressed to:
Ms. Molly Gavin or | Dйsirй Karyabwite |
INTRODUCTION
Purpose
1) To assess the current status of broadband access technologies.
2) To analyse broadband access technologies including the following dimensions: demographics, gender, geographic, technical and economic factors; market structures for delivery of broadband access service.
Output expected from the replies
The central output will consist of conclusions drawn from the data collected to include in the final report to assist ITU‑D Members with the development of broadband access technologies. This research will generate information on the technical, economic and development factors having an impact on the deployment of broadband access technologies in developing countries. At the end of the study period, a final and complete report will be created on Broadband Access Technologies. The present questionnaire is designed to provide extensive, consistent background data for the overall study, to be complemented, as necessary, in the yearly work plans.
Technology
What wireline technologies are utilized to provide broadband services:
____ DSL
____ Cable
____ E1/T1
____ Fibre
____ Power Line
____ Other (please describe)
What wireless technologies are utilized to provide broadband services?
____ Satellite
____ IMT-2000
____ Wireless local area network
____ Fixed wireless access
____ Other (please describe)
Competition
Is competition permitted in Internet services? (YES/ NO)
Is there competition in the local loop? (YES/ NO)
Is there competition among differing broadband technologies? (ex. DSL, cable, broadband wireless)
(YES / NO)
How many operators offer high-speed Internet service? ___________
Percentage of operators offering DSL broadband service ___________
Percentage of operators offering cable modem broadband service ___________
Percentage of operators offering wireless broadband service ___________
Percentage of operators offering other broadband service ___________
Access
Approximately what percentage of households have access to broadband access technologies in general? ___________
Percentage of households with access to DSL broadband service ___________
Percentage of households with access to cable modem broadband service ___________
Percentage of households with access to wireless broadband services ___________
Approximately what percentage of businesses have access to broadband access technologies in general? ___________

|
Из за большого объема этот материал размещен на нескольких страницах:
1 2 3 4 5 6 7 8 9 10 11 12 13 14 15 16 17 18 19 20 21 22 23 24 25 26 27 28 29 30 31 32 33 34 35 36 37 38 39 40 41 42 43 44 45 46 47 48 49 |
