
Партнерка на США и Канаду по недвижимости, выплаты в крипто
- 30% recurring commission
- Выплаты в USDT
- Вывод каждую неделю
- Комиссия до 5 лет за каждого referral
Table 4 – Respondent countries without competition in the local loop
• Cфte d'Ivoire | • Philippines |
• Ethiopia | • Egypt |
• Malawi | • United Arab Emirates |
• Mauritius | • Armenia |
• Barbados | • Belarus |
• Costa Rica | • Bosnia |
• Honduras | • Estonia |
• Israel | • Hungary |
• Maldives | • Lithuania |
• Nepal | • Poland |
• Pakistan |
Thirty-nine of the respondent territories have competition between different broadband technologies with only the following ten respondent countries having no competition:
• Ethiopia • Malawi • Barbados • Costa Rica • India | • Maldives • Nepal • Philippines • United Arab Emirates • Bosnia |
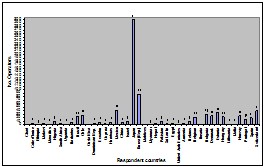
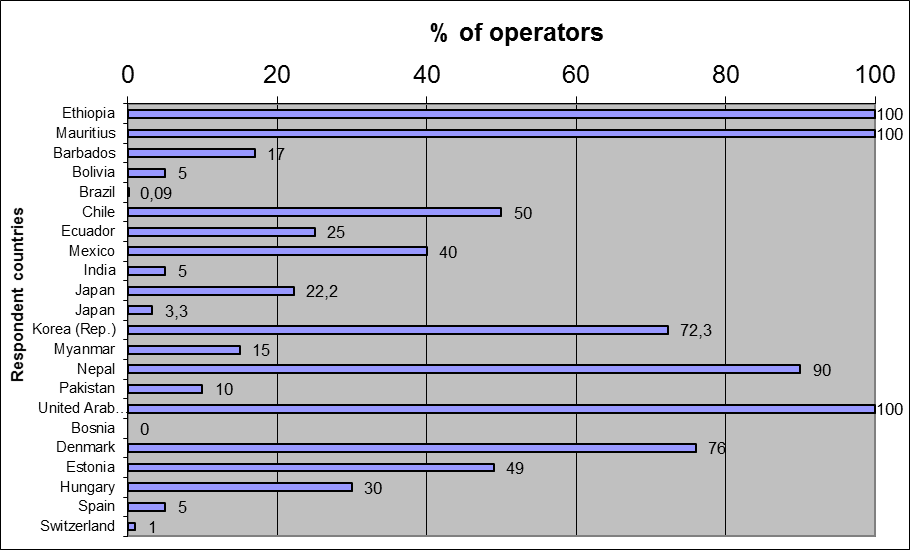
The following (Figure. 3) graph shows the number of operators offering high speed Internet:
Figure 3 – No. Operators offering high speed internet services
The following set of graphs shows the percentage of operators offering DSL, cable modem and wireless broadband-based services.
Figure 4 – Percentage of Operators offering DSL connections122
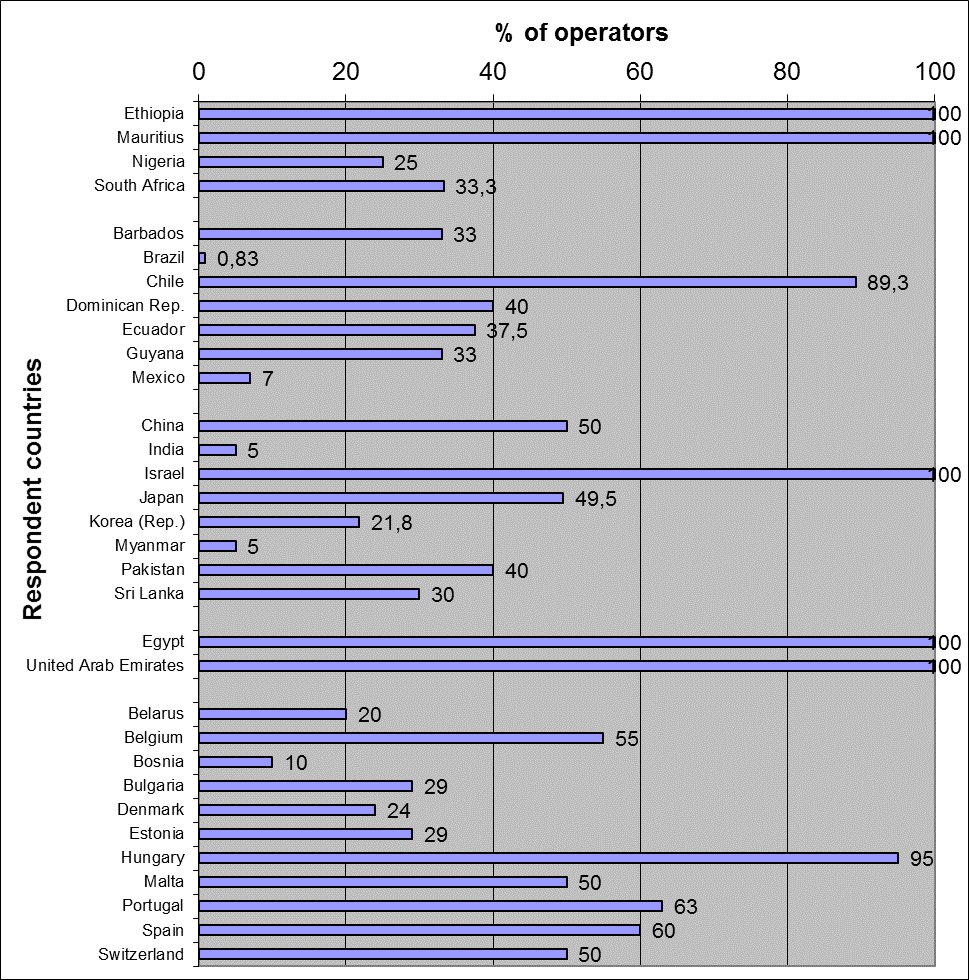
Figure 5 – Percentage of operators offering cable connections
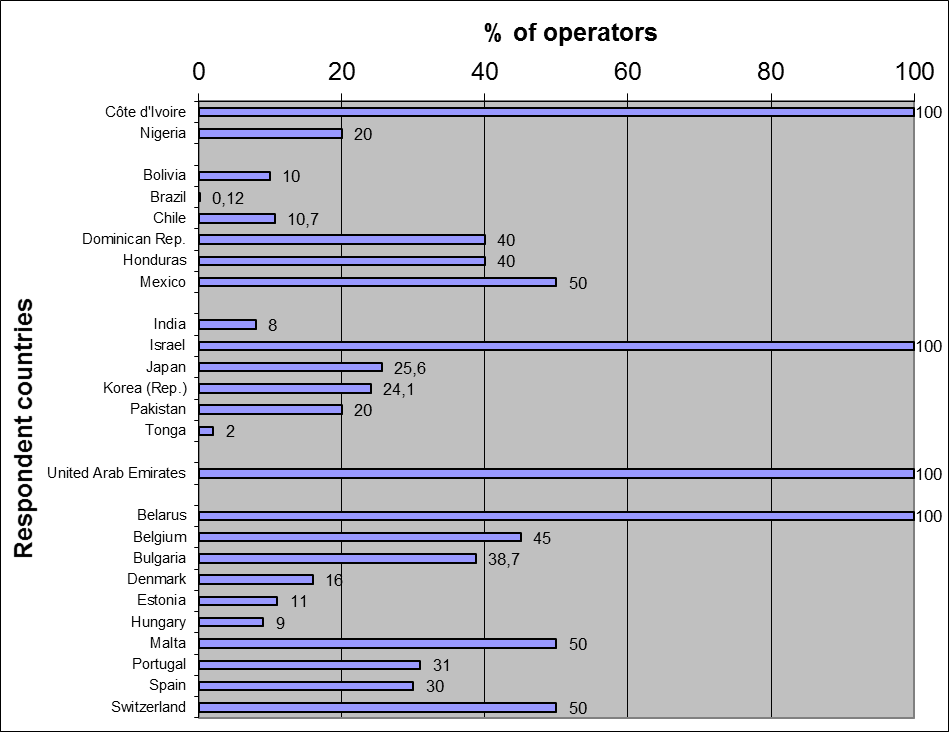
NOTE – Brazil’s response of 0.12% does not show on the scale used for this document.
On analysis of the responses received it became apparent that there might have been some confusion on in the responses for the number of operators offering cable-based services. A number of respondents reported that cable technologies were not used in their countries to deliver broadband services but did indicate that a percentage of operators offered cable based services. As a result of this seeming contradiction those companies that indicated that cable technologies were not used, have not been included in the above (Figure 5) graph.123
Figure 6a – Percentage of operators offering wireless connections
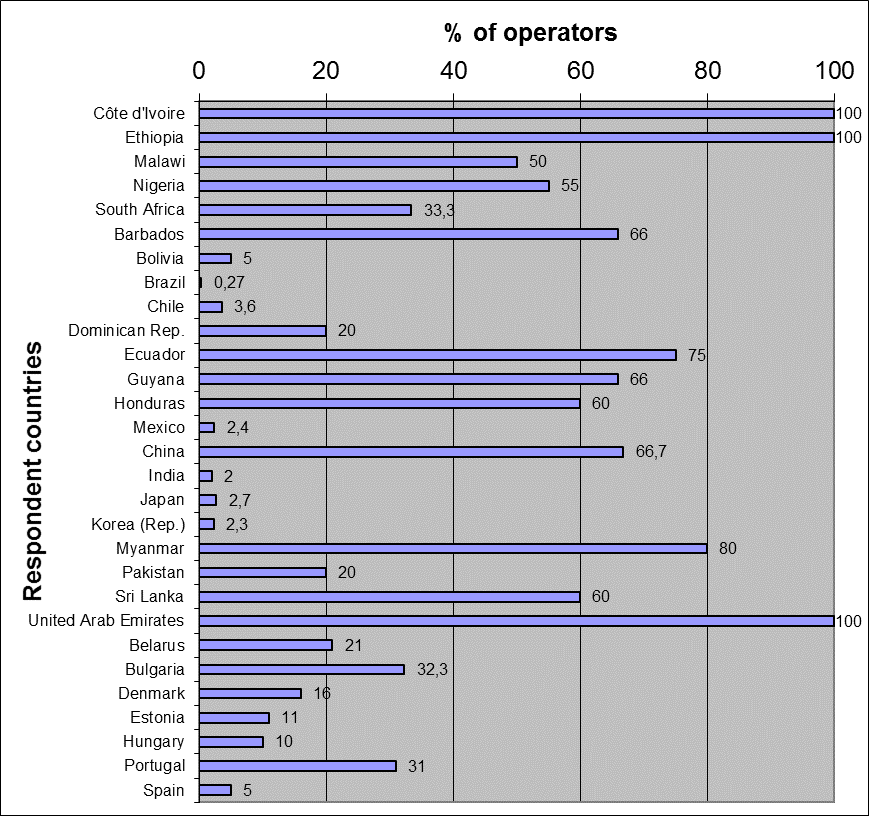
The percentage of operators offering other broadband access technologies such satellite, GPSR and optic fibre based networks, is shown in the following graph.124
Figure 6b – Percentage of operators offering other broadband connection technologies
Access
The Access section of the questionnaire sought data on the percentage of access to broadband technologies by households and businesses and rural telephone subscribers and whether or not gender barriers existed to accessing services delivered with these technologies. The situation in regard to accessing broadband technologies was well illustrated by respondents when considering the overall percentage of households that have general access. The following graph shows highlights the differences in access that exists between countries.
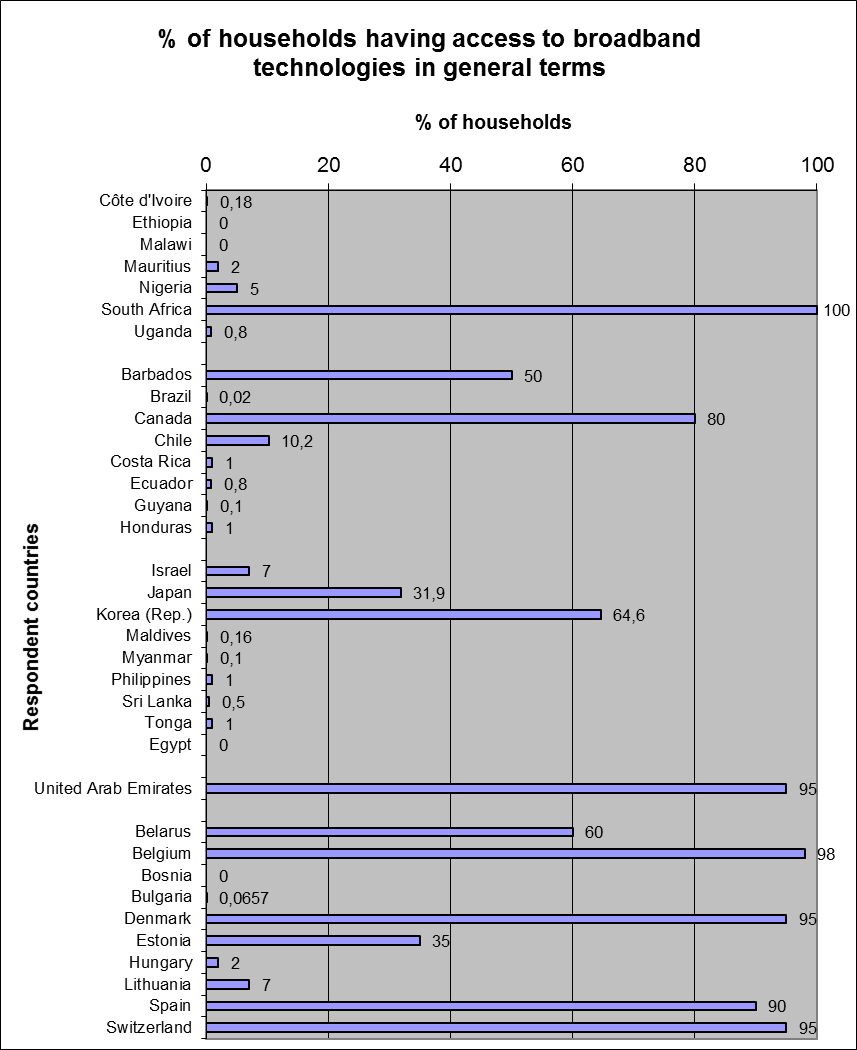
However, the graph itself maybe misleading since the original question was possibly misinterpreted by some respondents. The question was interpreted by some respondents as meaning the percentage of households having general access to broadband i. e. via home, public access point (school, post office etc) or commercial point ( cyber-cafй or telecentres) leading to figures such as 100% for South Africa or 95% for Switzerland. Other respondents interpreted the question as the number of individual households that have access (i. e. in the home) to broadband technologies. This was echoed in the figure of 10% for Switzerland supplied by the respondent from OFCOM. For the purpose of this document, the wider interpretation of the question was used (and hence in the case of Switzerland, the data supplied by SwissCom was used rather than that supplied by OFCOM), with this caveat attached that original question may have been misinterpreted by respondents and the data may not best represent the access situation in some countries.
Figure 7 – Percentage of households with access to DSL, Cable and Wireless
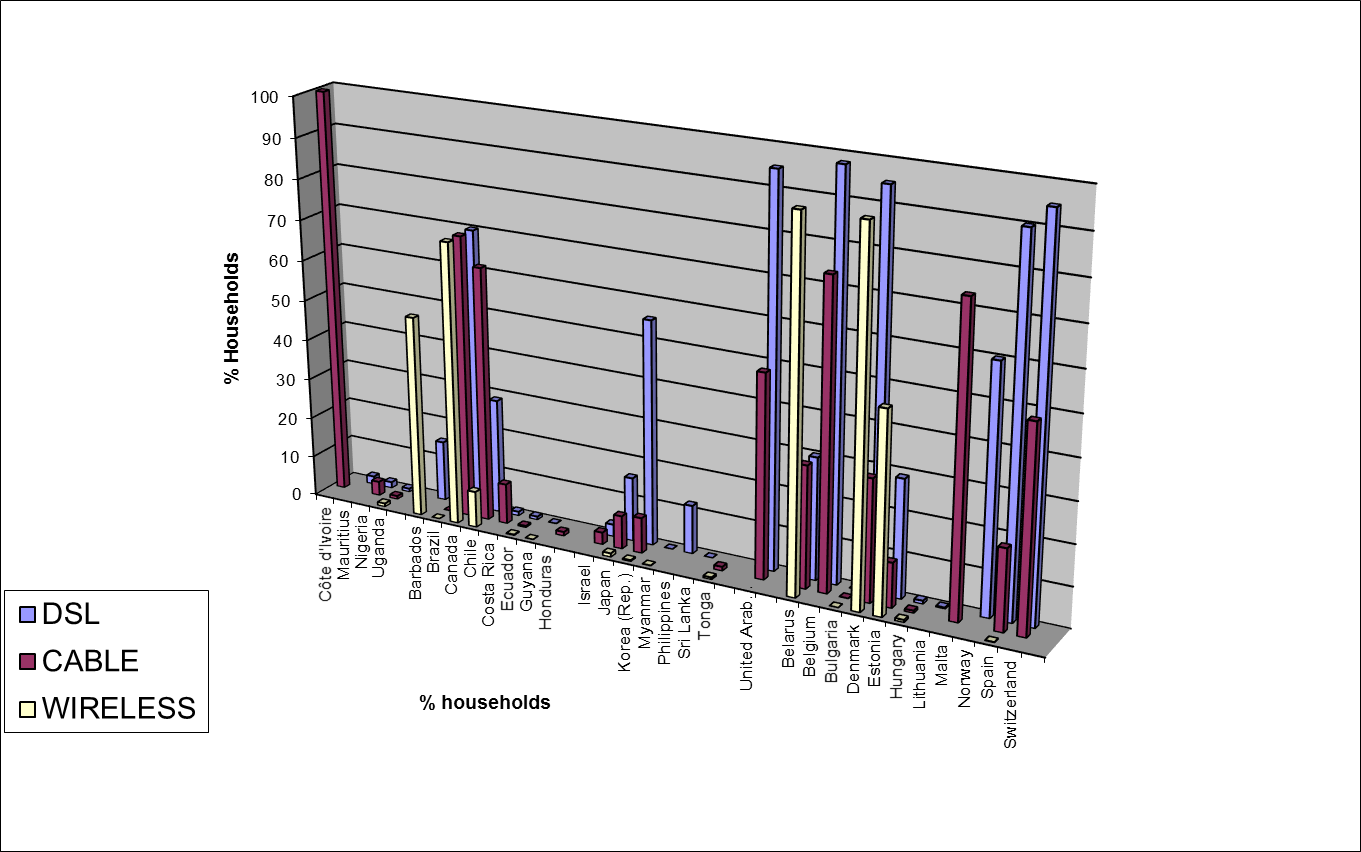
The situation shown in the previous graph depicting the percentage of households with access to DSL, cable or wireless technologies reinforces the access situation to broadband-based services. Many of the countries shown have only a fraction of 1 per cent of the households in the country with access to one or another of the three main broadband technologies. Some other countries – primarily developed ones, are well served with access via DSL, cable or wireless – or in some cases where local technology competition exists, the option to select between which technology best meets current need.
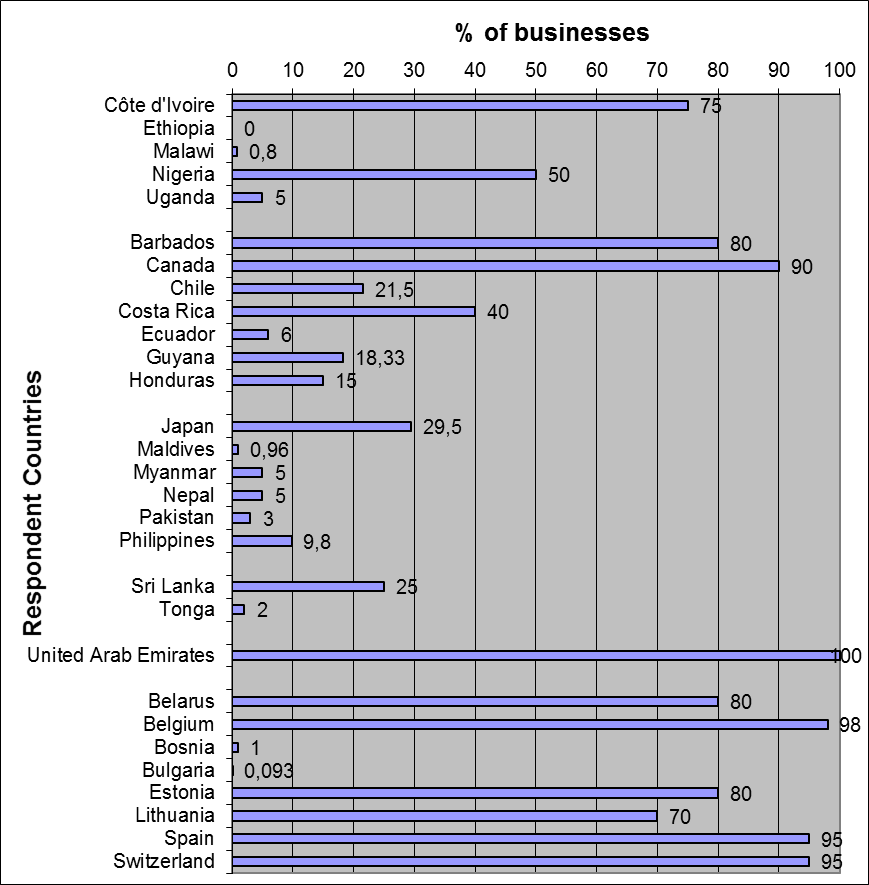
Business applications are one of the main drivers of adoption of broadband services. The following graph (Figure 8) indicates the percentage of businesses in respondent countries that have access to some form of broadband technology.
Figure 8 – Percentage of businesses with access to broadband technologies
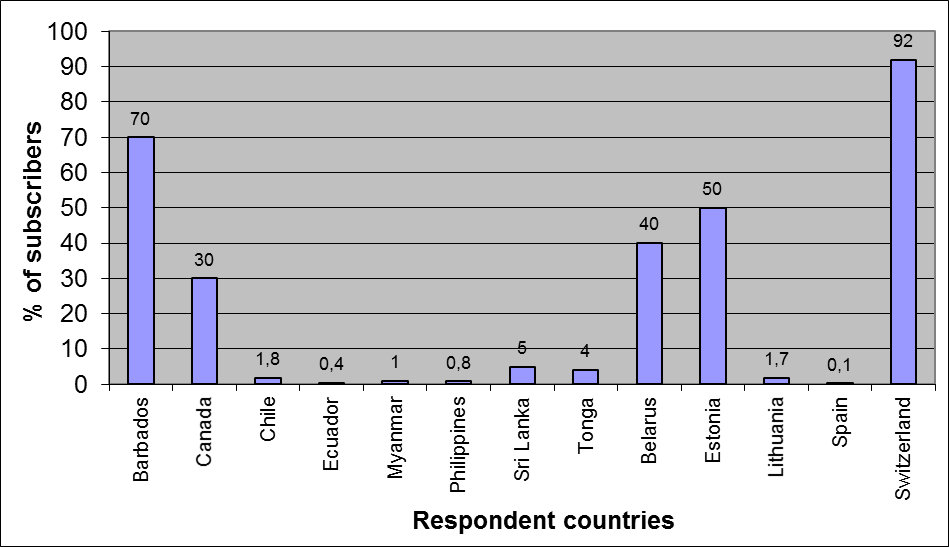
Business access to individual broadband technologies, illustrated by the following graph, echoes this structure and illustrates the larger role of wireless access for businesses in comparison with the household based access. Meanwhile the rural telephone subscribers access to broadband-based services graph, illustrates the differential in access problems facing developing and developed countries. As the graph clearly shows, in countries such as Chile, Ecuador, Myanmar, Sri Lanka and Tonga only a minute fraction of the rural population has access to broadband technologies. A number of countries including Cфte d’Ivoire, Malawi, Nigeria, South Africa, Honduras, Bosnia and Hungary stated that no rural telephone subscribers had access to broadband technologies.
Figure 9 – Percentage of businesses with access to DSL, Cable or Wireless technologies
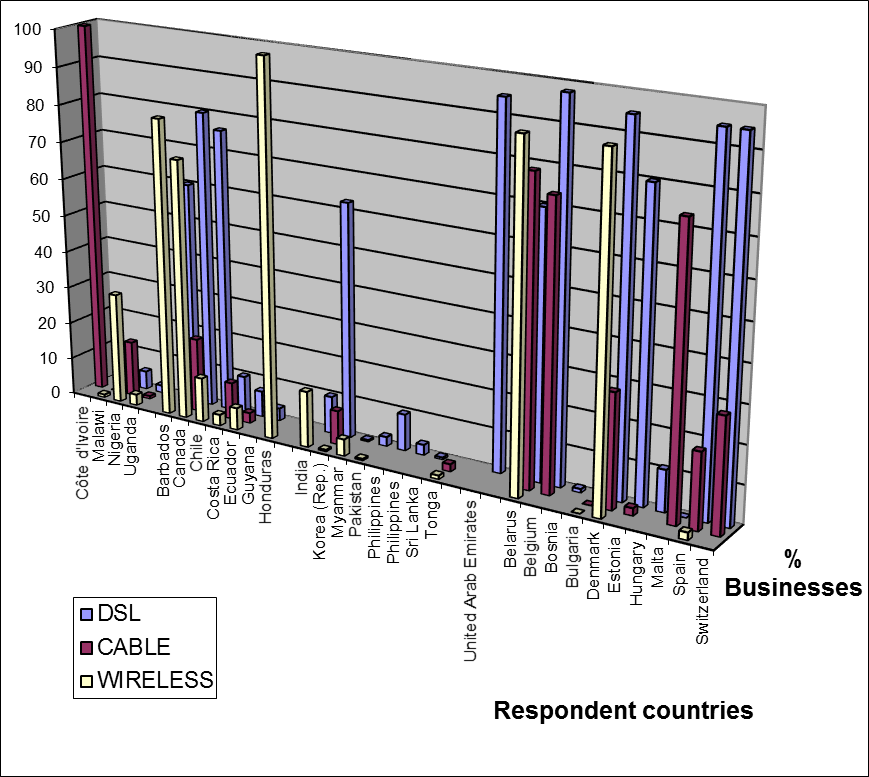
Figure 10 – Percentage of rural telephone subscribers with access to broadband technologies
Only six countries reported that there were gender barriers to broadband access, though the barriers they describe (given in Table 5 below) are also general barriers to the adoption of broad band.
Table 5 – Gender barriers to adoption of broadband
Country | Are there gender barriers | Description of barrier |
Chad | YES | Lack of awareness and the cost of computer training |
Guyana | YES | The issue of affordability arises. Due to Guyana’s economic situation, residential customers in particular would have no choice but to utilize their resources on immediate essentials rather than access to luxuries such as broadband |
Philippines | YES | Economical. The economic condition leads to market being price sensitive hence, DSL affordability becoming a barrier to broadband access. In the provincial areas market is very price sensitive |
Sri Lanka | YES | Infrastructure facilities |
Thailand | YES | |
Bosnia | YES | Economical |
Service pricing and usage
The service and pricing section of the questionnaire sought to establish average price for Internet dial up, average monthly price for broadband service (including Internet access) and whether or not operators offer unlimited usage plans as well as the most common usage/pricing plan for broadband services. Table 6 below, indicates the average prices for both dial up and broadband services on an ITU regional basis. As can be seen despite the variance in size and nature of the economies of those countries which respondent to the question there is a general convergence on the average price for Internet dial up accounts across ITU regions, however broadband prices show a marked variation between regions especially in terms of large bandwidth capacity based services.

|
Из за большого объема этот материал размещен на нескольких страницах:
1 2 3 4 5 6 7 8 9 10 11 12 13 14 15 16 17 18 19 20 21 22 23 24 25 26 27 28 29 30 31 32 33 34 35 36 37 38 39 40 41 42 43 44 45 46 47 48 49 |
